Integrated test system verifies image integrity of crt monitors
Integrated test system verifies image integrity of crt monitors
By Randal Chinnock, Contributing Editor
With the proliferation of display-monitor types and manufacturers, systems integrators have more choices in deciding which ones to buy and use in their systems. Despite this abundance, the majority of displays produced today still use mature cathode-ray-tube (CRT) technology. From consumer televisions to airport information signs to high-end digital x-ray displays, CRT monitors continue to thrive. Yet, despite their long reign, CRT testing techniques remain unstandardized and sometimes conflict with one another.
Meanwhile, monitor-test equipment continues to be improved by manufacturers incorporating the latest photonic and digital techniques. The results: CRT-monitor tests are steadily advancing in measurement accuracies, reduced test times, and decreased technician errors.
Computer monitors
Large computer companies such as Compaq Computer Corp. (Houston, TX) buy tens of thousands of CRT monitors to sell with their computer systems. Compaq wanted to ensure that information would be properly displayed on its monitors for various computer applications. Its goal was to better qualify the company`s monitors for luminance, chrominance, and geometrical characteristics (see "Important monitor measurement definitions," p. 32).
Bill Nott, a Compaq research and development display engineer, is responsible for putting sample CRT monitors through rigorous testing prior to volume purchases. He uses a Minolta Corp. (Ramsey, NJ) CS100 Chroma Meter to perform luminance and chrominance tests. The meter, a hand-held, tristimulus, spot colorimeter, uses three silicon photocells to sense different spectral bands according to Commission Internationale de l`Eclairage (CIE) standards. A noncontact device, it uses a 1° through-the-lens viewing subsystem, much like a single-lens camera. Device signal outputs include luminance units (candelas/square meter or foot-lamberts) and x-y chromaticity coordinates.
Luminance is measured by producing a full, flat (uniform) image field by means of a video generator and then sampling the screen at five points (center and four corners) on the monitor with the CS100 meter. Integrating the Minolta DP101 data processor into the system permits automatic logging of luminance and chrominance data.
Color uniformity is measured in the same manner as luminance uniformity. The x and y chromaticity coordinates are then plotted as functions of spatial coordinates.
Nott stores the data in a spreadsheet, and he sends copies to company management and the monitor suppliers. In an ideal situation, suppliers can compare the CIE coordinates with their test data and determine whether the monitor settings changed in the interim period. Correct chromaticity data ensure that the monitor colors are within specifications and meet uniformity requirements. If they are not, color-sensitive applications, such as display of medical tissue images, could be compromised.
Geometrical specifications
The Compaq monitors must also meet stringent geometrical image specifications. Geometry testing is especially important for machine-vision and other metrology applications where precise image representation is mandatory. The important monitor attributes that are measured include local nonlinearities (waviness), nonuniform magnification, raster size stability, jitter, swim, and drift. To ensure the monitors meet geometrical specifications, tests are conducted for image size, centering, pincushion/barrel, trapezoid, linearity, rotation, bow, and parallelogram.
When testing geometrical accuracy, image quality must be maintained when different display modes, such as 800 ¥ 600 or 640 ¥ 480 pixels, and different refresh rates, such as 72 and 84 Hz, are selected. Compaq performs these geometrical tests in a Helmholtz Cage so that the produced magnetic fields can be manipulated in three axes. After the monitors pass these tests, Compaq has verified that each will work at all locations around the world.
Previously, Nott used a ruler to manually measure geometrical attributes--a tedious and time-consuming process of measuring line positions on the screen relative to the bezel. Recently, however, Compaq leased a MIMiCAM-based automated monitor alignment and inspection system from Display Laboratories Inc. (Boulder, CO) to automate this procedure (see Fig. 1).
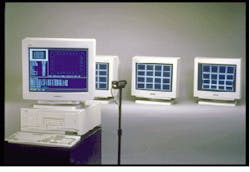
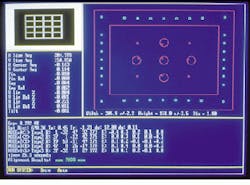
The MIMiCAM system consists of a Pentium-type computer, an ICPCI-2.0 digital capture board from Imaging Technology (Bedford, MA), an 801-GC pattern-generator board from Quantum Data Inc. (Elgin, IL), a proprietary communications (input/output) board, a monitor, and a 1k ¥ 1k charge-coupled-device (CCD) camera from Eastman Kodak Co. (Rochester, NY). To test a monitor, a pattern is first displayed on the screen and then captured by the CCD camera. The pattern`s features are then analyzed with patented, subpixel, image-processing algorithms.
Explains Craig Ridgley, director of sales and marketing at Display Laboratories, "By measuring light levels at adjacent pixels and interpolating the position of edges (light to dark transitions) in the test pattern, the systems software can resolve better than 1/10 pixel. This method allows the CCD camera to analyze monitors with pixel counts in excess of 1k ¥ 1k. The software can also compensate for mispositioning of the camera relative to the monitor under test by first measuring bezel location and later making geometrical adjustments to the screen data."
Compaq`s Nott confirms that the mispositioning compensation saves time and expense in test setup and fixturing and that the monitors are qualified faster. In addition, because suppliers can be alerted to problems more quickly, monitor production ramp-up can be started earlier.
Testing, testing
Now that Nott has his test laboratory fully equipped, he is trying to implement the same test system throughout the Compaq organization. He says, "The quality department could use it to sample incoming product from suppliers, while the service department could use it for evaluation and setup." Nott aims to lobby Compaq`s suppliers to use the same or similar test equipment in their production environments for aligning monitors in a fully automatic node, thereby removing geometric uncertainties throughout the process.
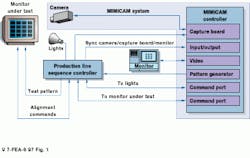
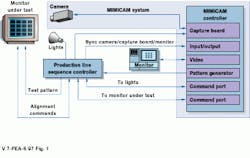
In such a closed-loop configuration, the MIMiCAM system generates images on the monitor under test, captures the test images, and then analyzes the test results. System-adjustment instructions are sent back to the unit via an RS-232 link. These instructions command the yoke and drive circuits to make adjustments that minimize geometrical errors. This adjustment cycle continues until the monitor meets all the specifications.
This test process takes much less time and produces much higher accuracy than manual methods. Ridgley claims that digital monitors are so complex that only a computer can align them adequately. With this monitor test technology, Compaq should be able to buy monitors at lower prices and with more consistent performance.
Future outlook
The International Organization for Standardization (ISO; Geneva, Switzerland) is the driving force in monitor-testing standards, according to Michael Grote at the National Information Display Laboratory (NIDL; Princeton, NJ). "It is definitely providing the standards for Europe now, and as it consolidates and updates its documents, its influence will grow," claims Grote. Other national standards groups are also documenting monitor display measurement standards (see " Display-measurement standards," p. 28).
Compaq`s Nott indicates that his company`s monitors do comply with ISO 9241. He is watching developments at ISO to determine what effects they could have on Compaq`s testing requirements.
FIGURE 1. Consisting of a Pentium-type computer with pattern generator, input/output, and capture boards, and a Kodak Megaplus ES 1.0 camera, the MIMiCAM system captures the images of the test patterns on the monitor under test. The data from the pattern measurements are used to calculate corrections to the geometry. Results are presented on an SVGA monitor.
Display-measurement standards
Video Electronics Standards Association (VESA; San Jose, CA) http://www.vesa.org
VESA Display Specifications and Test Procedures Standard 1.0 (October 1994)
VESA Image Area Definition (VIAD) Standard 1.0 (August 1993)
American National Standards Institute (ANSI; New York, NY) http://www.ansi.org
ANSI/SAE ARP 1782, Measurement Procedures for Airborne Direct View CRT Displays
ANSI/SAE ARP 4032, Human Engineering Considerations to the Application of Color to Electronic Aircraft Displays
ANSI/SAE AS 8034, Minimum Performance Standards for Airborne Multipurpose Electronic Displays
Electronic Industries Association
(EIA; Arlington, VA) http://www.eia.org
TEB25, A Survey of Data-Display CRT Resolution Measurement Techniques (June 1985)
TEB27, Relating Display Resolution and Addressability (September 1988)
TEP105-11-A, Measurement of the Color of CRT Screens (December 1988)
TEP105-17, MTF Test Method for Monochrome CRT Display Systems (July 1990)
ISO (Geneva, Switzerland)http://www.iso.ch
ISO 9241, Ergonomic Requirements for Office Work with Visual Display Terminals, consisting of 17 parts, Final Draft International Standard (FDIS)
ISO 13406, Ergonomic Requirements of Flat Panel Displays, Draft International Standard (DIS)
ISO 11064, Control Room Displays, Committee Draft (CD) version
R. C.
FIGURE 2. In an automated production environment, the MIMiCAM system is integrated with a production line sequence controller (top). Lights are used to illuminate the bezel for automatic positioning of the monitor relative to the camera. Once in position, an image is displayed and acquired. The system then sends commands to the monitor to make adjustments until the monitor is operating within specifications (right).
Important monitor measurement definitions
The key measurement parameters that affect the perceived image quality of displays include
Luminance. Luminance represents the emissivity of a display, expressed in candelas/square meter (nits). For CRTs, luminance is a direct measurement of the emitted light. However, luminance is not "brightness," which is the viewer`s perception of the display`s luminance. This perception cannot be quantified and is affected by other factors, especially ambient light. Luminance is generally measured by producing a full, flat (uniform) field using a video generator. Then, a number of points on the field are measured with a photometer, which can be hand-held or x-y scanned.
Luminance uniformity. Spatial and angular components of luminance vary considerably from one monitor type to another. To accurately measure the spatial component, use a video generator that produces a full, flat field; a point photometer that is capable of measuring luminance from an area smaller than 1/2 pixel or dot; and an x-y screen scanning instrument. To measure the angular component, use a goniometer head to angle the photometer or display in two axes. Several suppliers make computer-controlled devices that can automatically scan through a range of spatial and angular coordinates and also collect data. The data should be taken at various luminance settings, such as 25%, 50%, 75%, and 100% points.
Color uniformity. The color uniformity measurement is made in the same manner as luminance uniformity except that the photometer is replaced with a colorimeter or a spectroradiometer. If a colorimeter is used, calibrate it to a spectroradiometer. The x and y chromaticity coordinates are plotted as a function of spatial and angular coordinates. The locations of the coordinates, in accordance with a standard CIE chromaticity diagram, typically define the color temperature of the display.
Gamma. Gamma defines the nonlinearities in the output luminance versus the input drive characteristic. It relates to the display`s ability to represent shades of gray. To measure gamma, use the same equipment used to check luminance. However, the video generator must accurately drive the input signal to several known levels.
Luminance stability versus fill factor. As the light-versus-dark contents of displays vary, instabilities in the luminance can occur. These are tested by setting the display background to 50% of its rated luminance and then generating a white square in the center of the screen. The luminance of this square is measured as the square is gradually increased in size until it fills the entire display. A video generator that can produce the required square is needed along with the test equipment needed to measure luminance.
Reflectance. The reflectance of ambient light from the front of the display can have a marked effect on the contrast ratio and the perceived luminance. To measure reflectance, set up a controlled ambient source and stable photometric equipment. Use a photometer that can produce a narrow measurement field, such as 1° to 3°, a diffuse reflectance standard of 10% to 20% or a photographic "gray card," and a large-area, uniform light source.
Halation. Halation is caused by the bleeding of light from one emitting area to another and the reflectance and scattering of light in the front glass. The result produces a "halo effect" or softening of image detail. Measure this characteristic by producing a test pattern that consists of a small black square set in the center of a larger white square, which, in turn, is set within a black background. Use a point detector with a field equal to less than 1/2 pixel to scan the luminance across the black-to-white transitions.
Contrast ratio. Contrast ratio combines the data obtained from the luminance, halation, and reflectance measurements. The test data from these measurements are then mathematically combined to yield the contrast ratio.
Resolution. In general, resolution is the display`s ability to produce fine detail. In video applications, resolution is specified in television lines, or in its transform--modulation transfer function (MTF). In computer-display applications, resolution is described in addressable pixels. These are often assumed to be equal to "resolvable pixels," but this is seldom the case. For example, although an SVGA (800 ¥ 600-pixel) display might address that many pixels, the real visual performance or "resolvable pixels" of the display might be only 720 ¥ 540. Resolvable pixels is therefore the more accurate term for a visual attribute.
In monochrome CRT monitors, resolution is a function of the size and shape of the raster spot, contrast modulation (difference in luminance between closely spaced white lines and a black background), addressability, phosphor pitch, and halation.
In color CRT monitors, resolution is dependent on all of the monochrome factors, plus convergence (alignment of the three color beams) and moiré effects (interference between the shadow mask and phosphor spatial frequencies).
These resolution measurements require a video generator that can produce one-pixel-wide lines, both horizontally and vertically. The line widths are then measured with a field of less than 1/2 pixel and an x-y scanning system. Some suppliers have integrated these tests into computer-controlled image analyzers that use video cameras to re-image the monitor. The end results are measurements in MTF or resolvable pixels.
Geometry. Because of design limitations, many monitors exhibit variable image geometry. This geometry is an important consideration in designing machine-vision and other metrology systems where precise image representations are required. These geometry effects include waviness--can be either local nonlinearities that distort text and graphics or large area distortions such as keystone, rotation, and pincushion; linearity--the difference between the address of a pixel and its actual position on the screen; it can be expressed as a variable pixel density. The result produces distortion, that is, nonuniform magnification; raster size stability--If the high-voltage power supply is poorly regulated, the size of the overall image will vary with luminance. This effect is caused by droop in the power supply voltage as the output current increases; temporal instabilities, such as jitter, swim, and drift--these are all instabilities in raster position over time. Jitter is defined as instabilities over a 0.01- to 2-s time interval, swim occurs over a 2- to 60-s interval, and drift takes place over a 1- to 2.5-min interval. All four of these geometry effects are measured with a video generator, a narrow-field photometer, a CCD or photodiode array, and an x-y scanning system. R. C.


