DATA DISTRIBUTION DRIVES medical pattern recognition
DATA DISTRIBUTION DRIVES medical pattern recognition
It SPIE`s upcoming Medical Imaging Symposium in Newport Beach, CA, next month, the dominant theme will be image segmentation and pattern recognition. According to conference chairman Kenneth Hanson of Los Alamos National Laboratory (Los Alamos, NM), attendees will hear about standard approaches to pattern recognition based on statistical methods, especially in the sessions on computer-aided diagnosis.
Emerging medical pattern-recognition techniques such as model-based segmentation and extraction are also aiding in the reconstruction of three-dimensional images from two-dimensional input data. By using geometric deformable models of anatomical structures, region clustering capabilities can be improved (see "Image alignment helps visualize three-dimensional data, " p. 43.
Pattern recognition of medical images starts with the segmentation of source data, followed by feature extraction and classification. Choosing the right segmentation technique is the critical first step in the pattern-recognition process.
Choosing a classifier
Researchers use a variety of techniques to obtain good classifiers. Perhaps the most widely used and well-know technique is statistical pattern recognition. This is based on minimum distance, K-nearest-neighbor, and Baysian classifiers. Some researchers, however, prefer artificial neural networks to find data patterns and build classifiers when data distribution is difficult to understand. Others see a bright future in applying fuzzy techniques to clustering and edge detection (see "Fuzzy sets aid segmentation," p. 44).
Pattern-recognition classifiers are built on different assumptions about data. To sort patterns into known groups, classifiers must be chosen that are appropriate for the distribution of feature data. If the feature data and class separations produce data that are unimodal within each class--that is, the data are separable--the minimum-distance classifier can be used. With this classifier, new samples are assigned to the closest class that exists in the database of existing samples. It works quickly and has minimal training requirements.
Often, data distribution is more complex, so a more powerful classifier is needed. If the measurement data are normally distributed, the multivariate normal Baysian classifier is usually acceptable. If the distribution of individual features for each class roughly follows a Gaussian distribution, just a few parameters such as the mean and the covariance need to be estimated, and only a moderate amount of training is needed to obtain a good classifier.
Attempting to generate class labels for patterns (clusters, regions, features, and edges) when data are irregularly distributed is more difficult. If nothing is known about the data distribution, the K-nearest-neighbor classifier can be used. This classifier does not depend on having data distributions, like the Baysian classifier, because it looks at data locally and makes assignments based on a larger set of training samples that represent distributional irregularities of data. The K-nearest-neighbor classifier is a more complex classifier that requires more training.
A nearest-neighbor decision rule matches an unknown pattern to a known class by determining that it is the nearest pattern closest to that class by some given metric or distance function. With the K-nearest-neighbor classifier, K is the parameter that controls how closely a match is made. Experimenting with various settings of K optimizes performance and can speed computation, but testing needs to be made to maintain high-quality results.
After the number of different classes within an image is determined, a classifier that can best find them must be chosen. "Normally," says Mark Vogel, president of Recognition Science (Lexington, MA), "candidate classifiers are given samples that belong to the various classes of interest. The ability of different classifiers to discern these classes can then be tested.
"During training, a set of samples is run through a classifier, features extracted, and the performance of the classifer tested," said Vogel. A complex algorithm can take several iterations.
Helping developers
To help developers select attributes and features for classifier development, Vogel authored the The Recognition Toolkit, an add-on module for the KBVision System from Amerinex Applied Imaging (Amherst, MA). The toolkit uses probabilistic analysis to automate the evaluation and extraction, clustering, and training of accurate automatic classifiers. This automation is necessary in systems that are either too tedious or repetitive for human operators.
Once segmentation is complete, the Recognition Toolkit automates the recognition process. In unsupervised learning, clustering techniques compute the number of data classes. "Features and characteristics extracted from images can then be evaluated to determine which classification techniques are most useful," says Vogel.
Vogel, a proponent of statistical pattern recognition, says that anywhere an artificial neural network can be applied, K-nearest-neighbor, minimum distance, or Bayesian classifiers can be used. "Neural nets require more training data than other types of classifiers. After extensive training, neural nets approximate Bayesian classifiers, but the developer is not aware of the underlying reason," he says. By evaluating features, analyzing the data distribution, and building a statistical classifier, the problem can be better understood."
Automated cell analysis
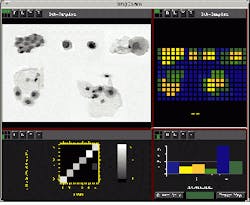
Automated image-recognition systems provide significant benefits for medical test analysis and as diagnostic aids. But, because medical images are varied, the development of reliable recognition processes is difficult. Luckily, in cell analysis, image databases with large numbers of samples are available and statistical recognition tools like the Recognition Toolkit can be used (see figure above). After extracting candidate features from images using image-processing techniques, the discriminative or classification potential of individual and paired features is calculated. This permits rank ordering of characteristic features and selection of the most useful features to implement a recognition system.
After collection of training images for each class that needs to be recognized, characteristic information is extracted from the images. As part of this analysis, unsupervised learning or clustering techniques can uncover any natural groupings in the sets of objects. This can also enhance the recognition process.
Only after an analysis of these features is the appropriate classification algorithm selected. This algorithm is then trained on prelabeled data and refined to provide the recognition accuracy desired. Finally, the trained classifier is tested against a new set of images to evaluate its final performance. This is vital to assure that the recognition system is not overtuned to the initial training samples.
Image alignment helps visualize three-dimensional data
Data-alignment techniques register two-dimensional image-data sets so they can be visualized as three-dimensional images. Often, images are obtained using different imaging modalities such as CT or PET scans. A common problem in image registration is matching one incomplete set to a reference set or two incomplete sets with each other. This kind of incomplete set registration is common in medical-imaging registration, where a subset of MRI, CAT, or PET images needs to be registered to existing models or atlases, histological sections need to be registered to 3-D organs, and registration of image sets of the same person must be taken at different intervals.
Robust algorithms are key in image alignment, according to Cengizhan Ozturk, a research physician at Drexel University (Philadelphia, PA). Ozturk is working on a distance-based geometric alignment technique for different medical-imaging modalities.
Distance-based alignment is a geometric matching method, and the results depend both on the objects and their initial positions. "Contour-based techniques are robust to local noise and some limited transformations," said Ozturk. Ozturk`s alignment technique minimizes the distance between two objects by starting with an initial assumption and iteratively minimizing the distance of the sample points.
Finding the closest points requires an exhaustive search for each point and can be time-consuming. To overcome this, distance vectors for all of the points in the plane or volume can be precomputed. Some of the distance transformations can be implemented in parallel for fast computation, especially in atlas-based alignment applications where several distance transformations of the atlas can be computed and stored, speeding up the future alignment processes.
Distance-based alignment is a good candidate for medical image registration, concludes Ozturk. "Because we do not require any reference marks, human input is not necessary and automation is possible," says Ozturk.
Fuzzy sets aid segmentation
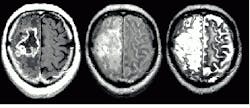
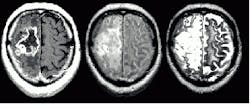
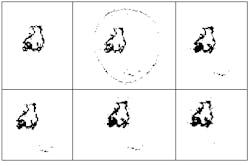
Researchers continue to develop fuzzy models for knowledge-based systems that provide good results without human intervention. In his survey, "Segmenting medical images with fuzzy models: an update," which appeared in Fuzzy Set Methods in Information Engineering ( R. Yager, D. Dubois, and H. Prade, eds., John Wiley and Sons, 1996), Jim Bezdek of the University of West Florida (Pensacola, FL) benchmarks several fuzzy-based segmentation methods for brain-tumor estimation from magnetic-resonance data. The book looks at methods based on supervised and unsupervised learning. The results of segmentation using several different crisp and fuzzy methods are shown in the figure.
The tumor highlighted in the NMR data above can be estimated using several clustering techniques. Figure A shows an expert radiologist`s analysis. Figure B shows the results of supervised k-nearest-neighbor segmentation. With unsupervised fuzzy c-means clustering (Fig. C) islands of data are left in the image. Validity-guided reclustering of Fig. C shows improvement (see Fig. D) while semi-supervised fuzzy c-means clustering still shows islands of data (see Fig. E). These islands can be removed with a knowledge-based clustering step (see Fig. F). This nearly correct segmentation result was created using fuzzy segmentation without operator intervention. None of the other methods shown in the figure were unsupervised.
Mark Vogel
Recognition Science Lexington, MA
E-mail: [email protected]
Cell images (top right) are first enhanced using an edge-preserving smoothing filter. Features are extracted and used in a clustering algorithm to look for classes (upper right). A histogram of the cluster classes (bottom right) permits developers to assign colors to each labeled class. A graph (bottom left) provides a preliminary indication of the reproducibility of these cluster separations when run through a simple classifier. High stability is indicated when nearly all samples are on the diagonal. Data was analyzed using The Recognition Toolkit from Recognition Science (Lexington, MA) and KBVision image-processing software from Amerinex (Amherst, MA).
Pattern matching speeds image registration
In a joint development, Impuls (Groebenzell, Germany) and Rodenstock (Munich, Germany) have combined forces to adapt Impuls` Vision XXL software to the Rodenstock scanning laser opthalmoscope (SLO). By visualizing images of a patient`s retina, the Ophtha-Vision system can diagnose cataracts and other retinal diseases of the human eye.
In operation, sequences of reflected laser light from the patient`s retina are digitized into a PC-based system. Unfortunately, due to inevitable patient movement during the scan, images are often misregistered. Worse, due to low light levels and interlaced image acquisition, images are often noisy. To compensate for this, the system geometrically reregisters images to make misaligned image sequences fit. Then, temporal averaging is used to reduce noise.
To align the different images in the sequence to the first image, a pattern-matching algorithm is used. To avoid the computational inefficiencies of the fast Fourier transform, pattern searches were implemented in the spatial domain. To improve performance, pyramid processing was used to speed up processing time by several magnitudes.
Once the orientation of images is known, a bilinear transformation geometrically corrects each image. Then, temporal averaging is applied to generate high-quality images. Temporal averaging increases the quality of noisy images by adding several images and averaging them.
Due to fast patient eye movements, some sequential images in the sequence can not be used because of motion blur. For these images the algorithm returns a very low certainty level. In the Optha-View system, these images are disregarded because they degrade the result.
Peter Schregle
Impuls GmbH
Groebenzell, Germany
E-mail: [email protected]
The Impuls Vision XXL image-analysis software for Windows 95 was used to create the Ophtha-Vision system because it featured customizable image-processing and analysis algorithms. Due to patient eye movement during image scanning, images must be reregistered before noise reduction by temporal averaging. The Ophtha-Vision user interface contains the tools necessary to register images (top right) and supports a manual and automatic mode (bottom right) that gives the experienced user more control of imaging functions.


