NETWORKED MULTIPROCESSOR RENDERS OPTICAL IMAGES IN THREE DIMENSIONS
NETWORKED MULTIPROCESSOR RENDERS OPTICAL IMAGES IN THREE DIMENSIONS
By Rick Nelson, Contributing Editor
Although computer-based two-dimensional (2-D) optical microscopy is a fairly mature technology, rendering a full, 3-D volume of optical microscopic data requires much greater computing power. Developing such systems requires improved microscopic preparation techniques, multiprocessing, 3-D visualization, and computer networking.
Researchers at the University of Chicago (Chicago, IL) and Argonne National Laboratory (Argonne, IL) have developed a prototype optical microscopy system that, with proper cell preparation, will allow dynamic structural changes of living cells to be observed in a three-dimensional (3-D) virtual environment. These researchers used data networking to cooperatively apply their diverse areas of expertise to the system, whose components are dispersed among Argonne and University facilities. The system includes custom image-acquisition hardware, parallel algorithms for image restoration and deblurring, and networks and client/server software to interconnect acquisition, processing, and visualization environments.
Image acquisition
The University of Chicago researchers developed the image-acquisition components of the 3-D optical microscopy system. To acquire images, the system uses a PXL cooled CCD camera from Photometrics (Tucson, AZ) attached to an Axioskop 20 fluorescence microscope from Carl Zeiss (Thornwood, NY). A tube containing cells to be imaged is held in a rectangular frame attached to the microscope stage. The microscope`s lens is positioned outside of the tube to digitize cross sections of cells. Illumination of the cells is provided by a shuttered mercury lamp controlled by an Indigo computer from Silicon Graphics (Mountain View, CA). When the source-light shutter is opened, illumination from the mercury light causes the cells to fluoresce, and resultant images are captured by the CCD camera.
For 3-D visualization, multiple 2-D images must be digitized. To do so, a specimen stage is moved quickly through a "step-and-shoot" sequence along the z axis. This makes it possible to acquire rapidly the multiple 2-D cross-sectional images needed to produce 3-D reconstructions. The "step-and-shoot" sequences used to section specimens in the z direction are possible because the University of Chicago investigators have used a custom stage. The stage was designed and built at the university and uses a piezoelectric-crystal positioner. Stage displacement varies linearly over a 15-mm range and is controlled by an Indigo computer. For imaging of an individual cell, the optical plane is adjusted manually until the top or bottom of the cell can just be seen. The z stage is then moved in increments that provide approximately 40 cross sections of the cell.
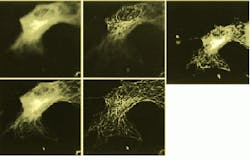
Each image of a 2-D section of a cell includes unwanted information from neighboring sections, resulting in a blurred image. Thus, the 2-D images must be deblurred. The system uses a measured point-spread function (PSF) for deblurring images. Because a measured PSF is used, most of the imperfections in the optics and most of the other nonideal characteristics of the system are accurately modeled. Measurement of the PSF requires acquisition of a set of 2-D images of a small fluorescent bead at the center of a neutral specimen slide. The acquisition procedure uses the identical procedure as that used to image cells. The result is the PSF, a set of 2-D images that represent the response of the microscope to a point object (the bead) at each of the optical planes used in the cell imaging sequence. The PSF is used with a nearest-neighbor algorithm to sharpen (deblur) cell images before they are reconstructed in three dimensions.
The nearest-neighbor deblurring algorithm used in the system is based on the assumption that blurring of image slices is caused by light scattering only from the slices directly above and below a specific slice. Because the algorithm requires limited data, deblurring of 2-D images on the IBM SP-2 computer can begin as soon as three slices of data have been acquired and transferred from the university to Argonne Laboratory. Thus, imaging and deblurring can occur simultaneously. As the deblurring of multiple slices can be distributed, deblurring of several slices proceeds simultaneously on the multiple nodes of the SP-2. Construction (stacking) of a 3-D image from the deblurred 2-D image occurs when all the slices have been deblurred.
Parallel computation
One implementation of the algorithm required 40 minutes of CPU to process a 39-slice data set on an IBM RS6000 workstation. To speed processing, the algorithm was distributed among multiple processors on an IBM SP-2 multiprocessor. In the deblurring stage, each of the processing nodes uses only three image slices (a working image and the images directly above and below the working image). Using 39 of the parallel nodes of the IBM SP-2, researchers performed deconvolution of the 39-slice data set in five minutes. Efficiency of this implementation is limited by I/O throughput because each 1-Mbyte image is read three times.
To improve processing time, the code was again modified so that each processor reads only its own working image and communicates with neighboring nodes to receive image data for the slices above and below. Because internal data exchange is much faster than data exchange between memory and disk (in an IBM SP-2 system, the two exchange speeds differ by a factor of nine), message-passing reduces image input time. Currently, it takes less than three minutes to deconvolve a data set.
Data transfer
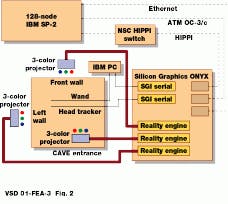
To view cells as 3-D images, Argonne researchers have written volume-visualization software for the CAVE (CAVE Automatic Virtual Environment) at Argonne. The CAVE, developed at the Electronic Visualization Laboratory of the University of Illinois (Chicago, IL), is a projector-based virtual-reality (VR) system driven by a Silicon Graphics Onyx graphics multiprocessor (see Fig. 2). Rear-projection display screens form a 10 X 10 X 10-ft room that viewers walk into. Computer-generated images projected onto the walls and floor of the CAVE are integrated to produce a seamless virtual space.
Client/server software allows transfer of unprocessed and processed data between Argonne and the University of Chicago for volume rendering. The network uses the TCP/IP protocol and is based on the Metropolitan Research and Education Network (MREN), a high-speed asynchronous-transfer-mode (ATM) network linking Argonne and the University of Chicago.
MREN uses ATM to provide a scalable networking system. The current peak speed of the network is 34 Mbit/s, which translates to about 20 seconds per 39-slice data set in the optical-microscopy application. An upgrade to 155 Mbit/s will enable the transmission of acquired images during the interval of normal image acquisition.
Volume rendering
Volume rendering is a visualization technique that displays a 3-D image as a translucent substance of varying opacity, making it possible to view the entire image at once. Texture mapping, a technique used to implement the volume rendering in the optical micro- scopy system, maps pixels of 2-D or 3-D images onto computer-graphical prim i tives, such as polygons.
In 2-D texture mapping, the pixels or "texture" of a 2-D image is drawn onto the corresponding pixels of a polygon. In 3-D texture mapping, the texture is a 3-D image, such as that produced by the optical image-acquisition system. If a polygon intersects the 3-D field, its pixels assume the values of the field that lie in the plane of intersection, "relaying" them to the display device, in this case, the CAVE walls. To accomplish volume rendering, a stack of polygons that spans the data volume is sent to the display device.
The goal of virtual reality is to make it possible for viewers to believe in the reality of a scene being displayed. For VR to operate well, viewers must be immersed in the virtual scene and manipulate objects in it. This requires a real-time update of the virtual scene being displayed. To produce a sense of realistic motion, VR displays must be updated at least ten times per second. Little volume rendering has been done in virtual environments until recently, because the time taken to render a single animated frame has been too great. On the Onyx, 3-D texture mapping is implemented in hardware, and volume rendering can be performed in real time.
To implement the 3-D texture mapping for volume rendering, input data from the 3-D optical microscope computation act as indices into a texture look-up table that contains the brightness and opacities to be displayed (see Fig. 3). Graphical buttons and sliders control brightness and opacity, allowing the user to segment the data by making certain ranges of values visible or invisible. Opacity can be adjusted to vary the display from translucent to opaque and brightness can be adjusted.
Results are optimal if the slicing polygons are kept perpendicular to the user`s line of sight. In a stereographic virtual environment, where the viewer can move in world space, the lines of sight can have any orientation, and the polygons must be rotated to remain perpendicular to them. (The polygons are kept perpendicular to a line of sight that extends from between the user`s two eyes.) Because the polygons can slice the texture volume at any orientation, the vertices of the clipped polygons must, in general, be recomputed for each animation frame.
Massively parallel software volume-rendering methods are now being explored using the IBM SP and other supercomputers. In the CAVE, techniques are being used to improve resolution of 3-D images that can be visualized and to explore polygonal surfaces to model input data.
REFERENCE
Randy Hudson et al., An optical microscopy system for 3D dynamic imaging, Mathematics and Computer Science Division, Argonne National Laboratory, Argonne, IL 60439, and the departments of radiology, pathology, radiation oncology, and academic computing services, University of Chicago, Chicago, IL 60637; http://www.mcs.anl.gov/home/hudson/micropaper/final.html.
FIGURE 1. Five images of a cell show optical slices as raw images (upper and lower left) and as deconvolved images (upper and lower middle). Reconstitued image (above) shows a rendering of 40 optical slices from the cell. (Images courtesy Jie Chen, Melvin L. Griem and Peter F. Davies of the University of Chicago).
FIGURE 2. Three-dimensional optical microscopy system consisting of the CAVE and the IBM SP is at Argonne National Laboratory.
FIGURE 3. This data set acquired by the University of Chicago 3-D microscopy image-acquisition system is displayed in a virtual environment at Argonne with a general-purpose volume visualization tool. (Image courtesy Randy Hudson of the University of Chicago and Argonne)
Company Information
Carl Zeiss
Thornwood, NY 10594
(914) 747-1800
Fax: (914) 682-8296
http://www.zeiss.com
IBM
(800) IBM-3333
http://www.rs6000.ibm.com
MicroBoards Technology
Chanhassen, MN
(612) 470-1848
Fax: (612) 470-1805
http://www.microboards.com
Photometrics
Tucson, AZ
(520) 889-9933
Fax: (520) 573-1944
http://www.photomet.com
Silicon Graphics
Mountain View, CA
(415) 933-7777
Fax: (415) 960-1737
http://www.sgi.com


