Choosing the correct optics
For every vision-system application, the optical system is critical to overall image quality, accuracy, speed, and repeatability.
By Greg Hollows
When building a vision system, you must consider the application, resolution, illumination, depth of field (DOF), field of view (FOV), processing speed, and other elements. But all too often, systems are built that either fail to meet performance expectations or utilize components that are overspecified. Both pitfalls are expensive because an underspecified system that fails must be redesigned until it works; an overspecified system contains components that are more expensive than needed.
Because a vision system extracts necessary information from an image, the application determines the required image quality. A system with sufficient image quality for one application may not be sufficient for another. The opposite can also be true, with many applications using overspecified components that do little more than increase cost.
The imaging ability of a system is the result of the imaging ability of the components. Every vision system needs illumination, a lens, a camera, and either a monitor or a computer/capture board to analyze the images. You should choose components to fit the application and complement each other. By avoiding overspecifying the quality on some parts of the system, you ensure that none of the components is more expensive than necessary.
To specify the appropriate lens for your application, there are variety of parameters and concepts that need to be understood. These concepts include FOV, working distance, resolution, contrast, telecentricity, and lighting rolloff:
Field of view: The viewable area of the object under inspection is the FOV; that is, the portion of the object that fills the sensor in the camera.
Working distance: The distance from the front of the lens to the object under inspection is the working distance.
Resolution: The minimum feature size of the object under inspection is its resolution.
Depth of field: The maximum object depth that can be maintained entirely in focus is the DOF. It is also the amount of object movement (in and out of focus) allowable while maintaining an acceptable focus.
Primary magnification (PMAG): PMAG is used to relate how much of an object will be seen on a given sensor array. For example, if a lens' PMAG is 2x and the size of the array is 6.4 mm, then a 3.2-mm FOV on the object will be seen on the array itself. Conversely, if the magnification of the lens is 0.5x, then the FOV will be 12.8 mm. PMAG can also be used to calculate resolution in a system as it relates to how much of the FOV is spread across the pixels in the array: PMAG = sensor size/FOV.
Sensor size: The size of the active area of the sensor in a camera, typically specified in the horizontal dimension, is important in determining the proper lens magnification required to obtain a desired FOV.
Resolution
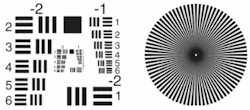
By considering the relationship between resolution and contrast one can understand the tremendously useful modulation transfer function (MTF). Resolution is a measurement of the ability of the imaging system to reproduce object detail. For example, imagine a pair of black squares on a white background. If the squares are imaged onto neighboring pixels, then they appear to be one large black rectangle in the image. To distinguish them, a certain amount of space is needed between them. Determining the minimum distance needed to see the two squares yields the limiting resolution of the system. This relationship between alternating black-and-white squares is often described as a line pair.
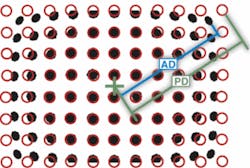
Typically the resolution is defined by the frequency measured in line pairs per millimeter (lp/mm). There are two different but related resolutions in play here: the resolution in object space (the size of elements in the object that can be resolved) and image-space resolution (a combination of the lens resolution and camera resolution). The sensor's line-pair resolution can be no more than half the number of pixels across on the sensor because a pair of pixels is the minimum required to discern a black-and-white area. The image- and object-space resolutions (described in lp/mm) are related by the primary magnification of the system. The limiting resolution of the system can be determined experimentally by imaging a test target (see Fig. 1).

Contrast describes how well the blacks can be distinguished from the whites. In the real world, black-and-white lines will blur into grays to some degree. Noise and blurring of edges will cause the contrast to decline. How effectively the differences between boundary areas on the image are reproduced relative to one another is often defined in terms of gray scale or signal-to-noise ratio. For an image to appear well defined, the black details must appear black, and the white details must appear white (see Fig. 2).
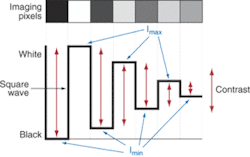
The greater the difference in intensity between a light and dark line, the better the contrast. Although intuitively obvious, it is more important than it may first appear. The contrast is the separation in intensity between blacks and whites. Reproducing object contrast is as important as reproducing object detail, which is essentially resolution. The lens, sensor, and illumination all play key roles in determining the resulting image contrast.
Contrast
The lens contrast is typically defined in terms of the percentage of the object contrast that is reproduced. The resolution and contrast of an image can be defined individually, but they are also closely related. In fact, resolution is often meaningless unless defined at a specific contrast. Similarly, contrast depends on resolution frequency.
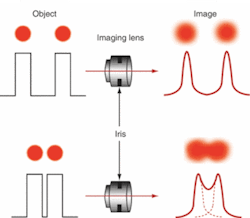
Consider two dots placed close to each other and imaged through a lens (see Fig. 3). Because of the nature of light, even a perfectly designed and manufactured lens cannot accurately reproduce the detail and contrast of an object. When the lens is operating at the diffraction limit, the edges of the dots will be still blurred in the image. When they are far apart (in other words, at a low frequency), the dots are distinct, but as they approach each other, the blurs overlap until the dots can no longer be distinguished. The resolution depends on the imaging system's ability to detect the space between the dots. Therefore, the resolution of the system depends on the blur caused by diffraction and other optical errors, the dot spacing, and the ability of the system to detect contrast.
Optical engineers usually specify a contrast level at a specific resolution. When a plot is made of contrasts at a range of frequencies, you have an MTF curve. Suppose we imaged a target of black-and-white parallel lines. Consider the effect of progressively increasing the line-spacing frequency of a target and how this might affect contrast. As one might expect, the contrast will decrease as the frequency increases. Taking the contrast values produced by a series of different line pairs plots the MTF.
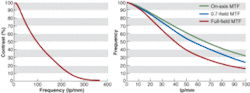
FIGURE 4. Modulation transfer function (MTF) curves represent the ability of a lens to reproduce contrast at a given frequency (resolution). Since the MTF can vary at different positions within the field, multiple curves need to be plotted to see the true performance of the lens. The graph on the right shows the MTF at three positions within the field—the middle, 0.7 of the field, and the full field in the corner of the image. The application requirements should be met at all points of the field, not just the center, to guarantee system accuracy.
The curve drawn from these points shows the modulation (in other words, the contrast) at all resolutions, not just at the limit resolution (see Fig. 4). It is important to note that the high-resolution end of the curve is not always the most important part of an MTF. For many applications, high contrast at a low frequency is more important than the limit of resolution. For such applications, a higher-resolution lens will not improve the overall system, although it could very well increase the cost. Instead, more balanced or brighter illumination may be all that is needed.
In addition, if you are able to obtain better contrast at the desired resolution for your application, you can actually decrease the system's processing time. This occurs because the finding and measuring of objects and edges is done more quickly if the image has higher contrast.
Resolution and contrast are not the same for every point in the field. Basically the farther out from the center of the image you go, the more resolution and contrast will fall off. This is not always a significant issue, since many lenses can outperform the sensor that they are coupled with at all point across the FOV. However, in many applications, if this is not considered, then the accuracy of the measurement taken can suffer at the edges of the field. This can lead to rejected parts being passed or good parts failed. Again, this information can be expressed in the form of an MTF curve.
There are other things that can be done to enhance the performance of a lens within the system. If you use only one color, then chromatic aberration is no longer an issue. If the system does not need to be color-corrected over the entire spectrum, the lens design can be simpler. Using a monochromatic design may also simplify the illumination system, since monochromatic LEDs use less power and create less heat than white-light incandescent bulbs. This effect can also be achieved by using color filters with a white-light source. Filters can be a very-low-cost way of greatly improving the capabilities of a system. Additionally, monochro- matic light sources and filters can perform color analysis.
Distortion
Distortion is a geometric optical error (aberration) in which information about the object is misplaced in the image but not actually lost. Distortion can come in a few different forms. One is monotonic distortion, which is distortion that is consistently positive or negative from the center of the image out to the edges. Monotonic distortion comes in two forms—barrel (negative) and pincushion (positive).
Distortion that is not monotonic goes back and forth between negative and positive distortion as you work your way from the middle of the field to the edges. Distortion that is not monotonic can occur from efforts made during the design of the lens to reduce overall distortion in the lens or from factors specifically related to the design type. In both monotonic and nonmonotonic designs, distortion is not linearly correlated to the distance from the center of the field
Whether the distortion is monotonic or not, software can factor it out so that accurate measurements can be made of the image. Using measurement software and a dot target of known size, you can measure the distortion at different distances from the center of the image (see Fig. 5). Once this is done, distortion can be either processed out of the image or taken into account during measurement. Removing distortion from an image and redrawing the image can be a processor-intensive operation. Most often, simply using the distortion calculations is all that is required and will help to shorten processing time.
Telecentricity
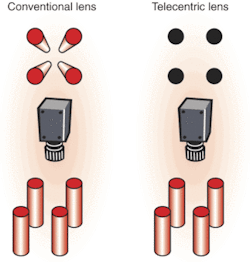
Perspective errors, also called parallax, are part of everyday human experience. In fact, parallax is what allows the brain to interpret the three-dimensional world. We expect closer objects to appear relatively larger than those farther away. This phenomenon is also present in conventional imaging systems in which the magnification of an object changes with its distance from the lens. Telecentric lenses optically correct for this occurrence so that objects remain the same perceived size independent of their distance over a range defined by the lens.
So, why is telecentricity desirable? What are its advantages, disadvantages, and limitations? For many applications, telecentricity is desirable because it provides nearly constant magnification over a range of working distances, virtually eliminating perspective angle error. This means that object movement does not affect image magnification. In a system with object-space telecentricity, movement of the object toward or away from the lens will not result in the image getting bigger or smaller, and an object that has depth or extent along the optical axis will not appear as if it is tilted (see Fig. 6).
In systems with image-space telecentricity, image-plane movements to focus or intentionally defocus the system will not change the image size. This property is fundamental to the microlithography industry, where tolerances on feature size are routinely less than 0.1 µm. Additionally, image-space telecentricity can lead to extremely uniform image-plane illumination. The normal cos4θ falloff (defined below) in image-plane illumination from the optical axis to the edge of the field is removed, since all chief rays have an angle of θ°with respect to the image plane.
There are a number of qualities inherent in telecentric lenses, however, that may be considered disadvantages. First, the optical elements in the region of telecentricity (image side or object side) tend to grow in size. In the case of a doubly telecentric design (telecentric in both object and image space), both the front and rearmost lens groups need to be bigger than the object and image, respectively. For example, if the object is 100 mm2 and needs to be inspected with a telecentric lens, then the front element or elements of the lens system need to be significantly larger than the diagonal of the part to provide an unvignetted field of view of the object. The diagonal of this object is almost 6 in., leading to a lens that is more than 6 in. in diameter. Such a lens would be very large and very heavy and would require special attention to mounting. Its size must be accounted for before building a machine into which it may be placed.
A common misconception concerning DOF and telecentricity is that they have a larger DOF than ordinary lenses. Realistically, telecentricity does not imply large DOF, which is only dependent on F-number and resolution. With telecentric lenses, objects still blur farther away from best focus, but they blur symmetrically, which can be used to advantage. As long as the features of the object are within the telecentric working distance, the magnification will not change. In other words, features closer to the lens do not appear larger than those further away.
Cos4θ rolloff must be considered in applications where a large sensor format or linescan camera is used. This rolloff can also be an issue in applications where large FOVs are obtained at fairly short working distances. Essentially cos4θ rolloff is the relative difference in the amount of light that makes it to the center of the image as opposed to the edges. It is determined by taking the cos4 of the angle created by the chief ray at the center of the image and the chief ray at the edge of the image. In many applications, this is not much of an issue, but when these angles become larger than 30° it can be problematic. This is especially true in linescan applications in which systems may already be light starved because of short exposure times. Pushing a system too far can have adverse results:
θ = 30° ⇒ relative illumination = 0.56
θ = 45° ⇒ relative illumination = 0.25
θ = 60° ⇒ relative illumination = 0.06
Rolloff must be kept in mind for systems with very short working distances that try to achieve relatively large FOVs because this design can produce large angles on the image side of the lens regardless of the sensor size. Rolloff can be controlled by designing the lens to be image-space telecentric. There are a limited number of image-space-telecentric lenses on the market, so a custom solution may be required.
Another option for offsetting rolloff is to compensate by creating unbalanced illumination on the object itself. Additional lights can be deployed closer to the edges of the object, or neutral-density filters can be added in front of the light source to reduce the relative illumination at the center of the object.
Ultimately you are building a complete system, but each element needs to be understood on its own to achieve the desired results. The optics used can greatly affect the overall image quality, help ensure accuracy and repeatability, and increase the overall speed of the system. The success of an application depends on fully recognizing that no one lens can solve all application issues.
GREG HOLLOWS, a machine-vision application engineer at Edmund Industrial Optics, Barrington, NJ, USA 08007; www.edmundoptics.com, organized the Technology Basics series.