Smart camera targets power-line droop

Sagometer accurately measures transmission-line droop and operation so that additional power can be transmitted within safety requirements.
By Jon Titus,Contributing Editor
Electric-power companies are constantly searching for new methods to meet user demands for more and more power. In a novel approach, power companies are exploring the "hidden power capacity" that exists in the long, high-voltage transmission lines that crisscross the country on tall pylons and towers. For instance, the Electric Power Research Institute (EPRI; Palo Alto, CA, USA) estimates that many transmission systems could safely carry from 5% to 20% more power through existing lines.
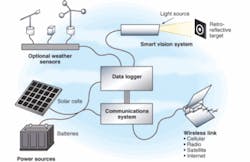
To ensure that goal, the Southwest Research Institute (SRI; San Antonio, TX, USA) and EDM International (Ft. Collins, CO, USA) have jointly developed the sagometer, a special measurement and gauging vision system, under the sponsorship of the EPRI and the California Energy Commission (Sacramento, CA, USA). The device is helping power companies push extra power through existing transmission lines (see Fig. 1).
In operation, the extra power heats the line conductors and causes them to expand. As a result, the power lines sag slightly toward the ground. But the lines are not allowed to droop below established engineering and safety limits. The sagometer accurately measures the downward sagging movement of power lines so that companies can transmit extra power and still meet safety requirements. These requirements, specified in the National Electrical Safety Code, necessitate ground clearances of 30 to 80 feet for power lines as they traverse fields, roads, rail lines, and structures. Sagometers are not needed on every transmission line, but the Tennessee Valley Authority, Public Service of New Mexico, Commonwealth Edison, and Long Island Power Authority have all installed these instruments to monitor lines.
Integrated instrument
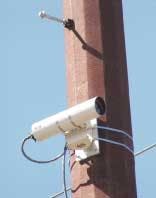
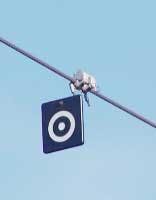
A typical sagometer includes a smart camera, lighting devices, a data logger, an RF-communication unit, and optional weather sensors, all firmly attached to a power-line stanchion or pole (see Fig. 2). A visual target attached to a power line 150 ft from the camera provides the measurement point for the sagometer (see Fig. 3). A laser-based surveying instrument positioned at the camera's mounting position lets a work crew accurately position the target to within a foot of the required 150-foot spacing. A typical installation of the target, sensors, camera, and data logger takes from two to four hours. Companies can install a sagometer permanently or move it from line to line, as needed.
During the installation of a sagometer, a calibration run is performed to establish the relationship between a foot of displacement at the 150-ft target distance and the same displacement measured by the camera. If the target distance differs by more than a foot or so from the specified 150-ft span, a crew can calibrate the sagometer on-site to yield a new pixel-per-foot ratio for that specific setup.
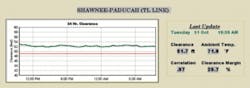
At the 150-ft spacing, a typical sagometer "sees" displacements as 46 pixels/foot, so the instrument can resolve changes in a target's position of about 1/4 in. This resolution enables the sagometer to accurately measure a target's vertical and horizontal displacement (see Fig. 4). Knowing the target's actual measured height, or ground clearance, at the time of installation allows the sagometer to compute—in real time—the clearance distance and any displacement due to wind. The sagometer camera also permits technicians to monitor such parameters as ice buildup and local environmental conditions.
Smart sensing
The sagometer does not use a PC or a frame grabber. To simplify the design, the development team chose a smart camera from Vision Components (Ettlingen, Germany) that includes a user-programmable ADSP signal-processing chip from Analog Devices (Norwood, MA, USA). This chip processes images to measure target displacement and performs the complex tasks of target pattern recognition and exposure control.
The camera also contains a special analog circuit that produces a "stair-step" voltage waveform of the video data, so that, unlike the continuous video signals from a regular camera, a discrete voltage level exists for each pixel. An on-board analog-to-digital converter digitizes the pixel data to produce what is called "pixel-identical" information because a distinct gray-scale voltage exists for each pixel.
After digitizing the data, the camera's circuits pass it to the ADSP-2181 DSP chip via a direct-memory-access channel. Every 64 µs, the chip transfers its internal buffered data to a bidirectional buffer that connects the camera to external devices. The DSP chip also can access DRAM for data storage and FLASH memory that stores the camera-control and image-processing software.
Program development for the camera's ADSP chip used C and assembly languages and a range of third-party tools. Vision Components provides additional software such as a real-time operating system, an in-circuit emulator, an image-processing library, a measurement library, and JPEG compression/decompression tools. The image-processing library includes a range of filters and transforms, as well as signal-processing and feature-extraction routines.
Target viewing
Even with the available software tools, image-processing parameters challenged the sagometer developers because operational conditions ranged from viewing a dark target at night to observing a bright target framed with sunlight. The development team wrote custom routines to handle these complex contrast-control functions.
A pattern-location algorithm is used to find the target in an image with a two-dimensional cross-correlation technique. (In this application, correlation measures the "goodness of match" between two patterns.) The software correlates each image with a sub-image, or kernel, of the target and produces a correlation value for each pixel. The higher this value, the more likely a match exists between the kernel and an area in an image. The correlation value reaches its maximum at the target location.
To ease the task of recognizing the target, the development team chose a pattern of light and dark concentric "bulls-eye" circles. Therefore, when wind moves a power line horizontally and the target rotates slightly, the target still looks the same to the camera. A checkerboard pattern, on the other hand, would appear tilted, which would complicate the pattern-location algorithms.
For the pattern-location algorithm to operate properly, an image cannot contain regions that closely duplicate the target pattern. Horizontal and vertical patterns often appear in built-up areas, but it is unlikely that natural or man-made structures would duplicate a bull's-eye pattern.
The developers also faced a design challenge in lighting the 9 × 9-in. target at a distance of 150 ft from the camera. They explored two lighting techniques;one used infrared (IR) LEDs and the other used laser diodes. In both techniques, the weatherproof camera enclosure houses the light sources. Because the target moves, the LEDs or laser diodes must illuminate an area of about 10 × 14 ft, with the target at the center.
The emission from the IR LEDs closely matches the responsivity of the camera, which helps overcome problems of light loss over a 300-ft round-trip path to and from the target. Although a controller could turn the LEDs on or off, to simplify operation the LEDs are constantly energized. However, newer sagometer designs are using two laser diodes that operate at about 635 nm; the laser diodes are always powered. Because a laser diode provides a small illuminated spot, the light source includes lenses that slightly spread the two laser beams.
The target provides a retroreflective surface, such as the material used for reflective street signs; this material efficiently returns most of the reflected light toward its source, rather than scattering it. This type of reflective surface increases the apparent efficiency of the light sources. Although the sagometers use mostly off-the-shelf components, EDM and SRI engineered the target and the light sources specifically for the sagometer design.
Because the sag in a line can result from several environmental conditions, not just the amount of current in the power conductor, a sagometer must measure local conditions, as well as target position. For example, weather sensors on a typical pole installation measure temperature, rainfall, solar radiation, and wind speed. These sensors connect to a data logger that records readings and the position data provided by the smart camera. Depending on the power-transmission company's needs, the data logger can download the sagometer data on demand, transmit data in real time, or transmit the data from the sagometer over the Internet, all though a wireless link.
The data can be accumulated in a database for later analysis or flow into a software package called Dynamic Thermal Circuit Rating (DTCR), provided by EPRI Solutions (Palo Alto, CA, USA). The DTCR package uses real-time measurements of circuit load, weather conditions, line tension, and other characteristics to determine the actual current-carrying capacity of a power line. Using the sagometer data, the software provides a realistic assessment of the state of the power lines.
The data can also flow into a real-time rating module that interfaces with PLS-CADD, a computer-aided design and drafting package from Power Line Systems (Madison, WI, USA).
Using this software, the real-time sagometer data helps engineers make predictions about line behavior.
Company Info
Analog Devices www.analog.com
Campbell Scientific www.campbellsci.com
EDM International www.edmlink.com
Electric Power Research Institute www.epri.com
EPRI Solutions www.epri.com/eprisolutions/
Power Line Systems www.powerlinesystems.com
Southwest Research Institute www.swri.edu
Vision Components www.vision-components.de
features, advantanges, benefits

Blake Forbes, principal engineer for transmission, Public Service Company of New Mexico (PNM; Albuquerque, NM, USA), says that by using video sagometers, PNM can estimate the remaining conductor life based on the exact temperature history of a power line. As a result, PNM runs its lines cooler than conservative predictions suggest, and the company expects to get 30 to 40 more years of conductor life before the cumulative effect of high-temperature operation requires their replacement.
The high cost of rebuilding these lines to handle contingency requirements, combined with the uncertainty of obtaining permits on a reasonable schedule, caused PNM to consider sagometer techniques. Sustained temperatures above 100°F on a typical aluminum conductor steel-reinforced conductor can cause a loss of strength due to annealing of the steel strands. When the temperature of the core is raised, it shortens the conductor's life. At PNM, once the conductor strength drops by 10%, it is replaced. This limit is reached after 200 hours of high-temperature operation.