Digital data from satellite imaging determines landscape plans
Digital data from satellite imaging determines landscape plans
By Lawrence J. Curran, Contributing Editor
Using images transmitted from remote sensors on Earth-orbiting satellites to extract information about terrestrial features is not a trivial task. This type of imaging data is available from several commercial companies, but these data are usually delivered in raw digital form. A Canadian government agency is meeting the challenge of converting satellite data into manageable form with a PC-based system in a program aimed at improved ecosystem planning and management in the province of Manitoba.
The agency--the Manitoba Remote Sensing Centre (Winnipeg, Manitoba, Canada), a unit of the Land Information Division of the Manitoba Department of Natural Resources--recently joined a science team that had launched a one-year ecosystem pilot project supported by the province. The objective of the project is "to generate a holistic approach to managing the natural ecosystem in the province, including the air, soils, forests, water, and wildlife," according to Roy Dixon, the centre`s chief of remote-sensing applications.
Analysts at the centre receive digital imaging data gathered by remote sensors on NASA`s LANDSAT satellite, which is in a nearly circular polar orbit at an altitude of 705 km, providing coverage of regions of interest every 16 days. Dixon says the primary sensor is a thematic mapper, which gathers seven channels of data in a spectral range that includes the visible and near- and mid-infrared regions.
The LANDSAT signals are received at the Canadian government`s Prince Albert satellite station in central Saskatchewan. The Manitoba centre purchases the data in raw digital form on CD-ROMs from a commercial distributor, analyzes and classifies the data, and ultimately will deliver to the Manitoba provincial government a digital geographical data set to be used for analysis and ecosystem planning.
Data analysis
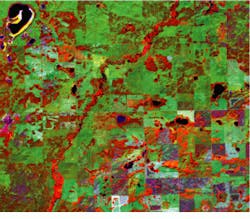
Staff members at the Manitoba centre, who specialize in various disciplines (for example, biology, cartography, forestry, geography, and remote sensing), analyze the imaging data from the perspective of their specialties, using a 300-MHz Pentium II-based IBM PC equipped with an 8-Mbyte graphics accelerator card and specialized application software. They examine the displayed data in an effort to classify it--and the regions it depicts--by type, such as agricultural, deciduous forest, conifer forest, grassland/rangeland, trees and open bogs, marsh, and fens (see Fig. 1).
"These are raw images with information generated in three or four spectral bands," says Dixon, "and we have to turn it into information about the landscape, including the biology and hydrology." To classify the raw data, an analyst takes an area of known ground features and determines whether those features represent a conifer forest, for example.
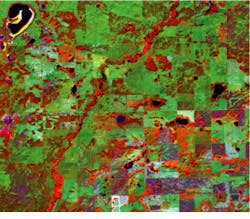
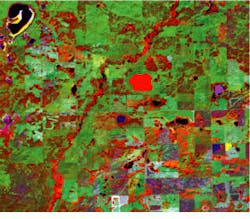
The analyst then defines a so-called "training area" to digitally describe a conifer forest. A training area consists of a box or polygon drawn by the analyst around an area that contains statistical information within the spectral bands of the LANDSAT data. "Those data are represented by a digital number in a matrix, and we tell the computer that number represents a conifer forest," Dixon explains. "The analyst then asks the software to seek data (in each, as-yet unclassified, pixel) similar to the information contained in that training area, so that we can determine what classification to give the compared data," Dixon adds (see Fig. 2).
Several algorithms are applied to the data by the personal computer. A primary algorithm is maximum likelihood classification, a standard algorithm used in this type of remote-sensor processing, according to Dixon. Others include image enhancement with a linear stretch, intensity-hue-saturation color transformation, principal component transformation, image filter processing, ratioing or normalization, and parallelepiped classifier.
All these algorithms are included in the V-image program supplied to the Manitoba centre by VYSOR Integration Inc. (Gatineau, Quebec, Canada). The centre uses additional software in the pilot program, including PCI remote-sensing software from PCI Inc. (Richmond Hill, Ontario, Canada); ER Mapper from Earth Resource Mapping Inc. (Perth, Australia); and the IDRIS geographical information system (GIS) from Clark University (Worcester, MA).
After the data are correctly classified, the Manitoba centre analysts will initially generate a digital format that can be downloaded into a GIS. The GIS will also include other data sets to aid in statistical analyses that will highlight sensitive areas in the regions of interest. Ultimately, all the data will be applied to assist the Manitoba provincial government in the planning and design of the ecosystem, Dixon says.
The IBM PC used in the ecosystem project contains 128 Mbytes of RAM compared to the 32 Mbytes installed in a 90-MHz Pentium-based IBM computer used earlier. The upgrade allows the analysts to complete a batch job in 2.5 minutes that previously required 10 minutes, according to Dixon.
Remote sensing
Developer Stewart Dibbs, VYSOR president, says V-image grew from a need expressed by VYSOR clients in 1992 for "an inexpensive but reasonably functional remote-sensing package to run on a Windows desktop." At that time, VYSOR provided support for obsolete VAX-based remote-sensing hardware and software, and "I used my familiarity with that software suite to produce a Microsoft Windows 3.1 version of V-image using Paint Shop Pro (PSP) 2 as the central display engine," reports Dibbs.
To make a usable remote-sensing software suite, all the additional remote-sensing utilities (such as histograms, scattergrams, training areas, spectral signature generators, and remote-sensing library functions), other tools (such as maximum likelihood classification, postclassification, and principal components analysis), comprehensive help files, and training materials were written using VYSOR`s PiXCL graphics and image-processing language. This language was originally included in V-image "as an easy-to-learn scripting language to help users create their own new applications," Dibbs says, adding that most current remote-sensing packages provide some similar facility.
Dibbs points out that V-image acts as a toolbar controller for the additional functions that have to be performed externally to the display engine, but can interact (via drag and drop) with it when necessary. "For example, creating training areas requires some initial work in the display engine to create a mask file. Next, V-image modules are invoked to read the training areas and to create statistics and spectral signature files, which get passed to the classifier," Dibbs explains. Most of the V-image functions are disk-to-disk functions: an input file set creates an output file set, which is then passed to the display engine for viewing and analysis.
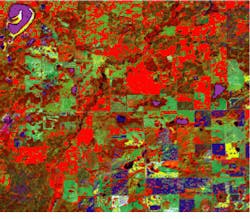
The display engine for V-image 1.98 is Paint Shop Pro 4.14. Dibbs says it incorporates a broader set of tools than PSP 2, such as more detailed image processing and enhanced image masks to make the selection of regions of interest much easier, and a 32-bit Windows environment that eliminates image size restrictions (see Fig. 3). PSP 4.14 also provides more capable image-editing options. A proprietary display engine is in development for release in the next major version of V-image. It is integrated with an extended version of PiXCL called geoPiXCL.
The additional image-processing tools in the latest V-image include training-area creation and extraction; multispectral signature creation; a parallelepiped and maximum likelihood classifier; postclassification filtering (sometimes called custering); multispectral color compositing; nonlinear enhancements; histogram normalization and equalization; color remapping; integration of V-image components with the PSP 4.14 display engine; and associated help files. There is some overlap of PiXCL image-processing functions in PSP, mostly additional file formats, "and PSP is an excellent image editor," says Dibbs.
Dibbs believes the major appeal of V-image for the Manitoba centre is that it provides an easy-to-learn and consistent user interface to all the frequently used remote-sensing and image-processing functions used for daily operational work. It can also be quickly extended when required. "Clients report that they regularly use 80% to 90% of the V-image functions compared to 20% to 40% of other large software suites of all types," comments Dibbs. Dixon and Dibbs have been associated since 1985, when Dixon was also a client of the company that supplied the earlier VAX-based software that sparked Dibbs` idea to develop remote-sensing Windows PC-based image-processing software.
Dixon says, "V-image is important to us; we couldn`t do our analyses without it. It is a relatively inexpensive and easy-to-use package." Ultimately, residents of Manitoba will enjoy a better-balanced ecosystem as a result of the program`s utility.
The images displayed in the figures of this article show typical representations of the processes used at the Manitoba Remote Sensing Centre to create `training areas` and to classify satellite data. However, they do not directly represent the centre`s ecological study because final results have not yet been determined.
FIGURE 1. False-color image of LANDSAT thematic mapper data is made up of Band 7 (near infrared, in the red channel), Band 5 (visible red, in the green channel), and Band 4 (visible green, in the blue channel). The large kidney-shaped object (top left) is a small lake surrounded by bare ground, probably sand. Water appears almost black in the near-infrared. A small water body (below center) has significant reflectance in the blue channel, probably caused by either shallow water or suspended organic material. The varying shades of red indicate a string reflectance in the near- infrared, which is seen as healthy green vegetation with a high chlorophyll content. The various shades of green are uncultivated prairie grasslands. Cultivated fenced fields with little vegetation appear as dark blue-gray.
FIGURE 2. Five training areas are outlined and overlaid onto the raw image. Class #1-red indicates probable prairie grasslands. Class #2-green is a probable dry and sandy runoff area from the nearby water body. Class #3-blue shows fields with little vegetation. Class #4-yellow represents probable plowed fields with bare soil. Class #5-magenta depicts nonturbid water bodies. These training areas will be used to perform a maximum likelihood classification to identify all similar pixels in each class over the whole image.
FIGURE 3. Image classification has been performed, and the resulting class file is overlaid onto the original image. The Class #1 pixels are identified as the majority of the image. Class #4 has identified some other highly reflective pixels, but ignored the visually similar feature at bottom center. This may be caused by a different soil chemistry in the feature and the training area, generating a different spectral signature. Class #5 has identified the nonturbid water bodies, while ignoring the turbid water body just below center.


