Flexible software helps microscopy platform rate magnetic materials
Flexible software helps microscopy platform rate magnetic materials
R. Winn Hardin
Contributing Editor
Approximately 40% of plant-generated electricity is lost to resistance from standard copper wiring before it reaches businesses and homes. Researchers at the University of Wisconsin at Madison Applied Superconductivity Center (ASC), in conjunction with companies and
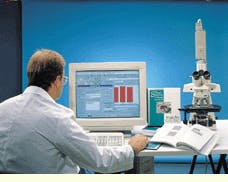
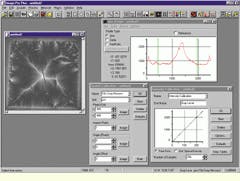
universities worldwide, are trying to overcome these power losses and other similar applications through microscopy research (see Fig. 1). One such approach uses Media Cybernetics (Silver Spring, MD) Image Pro Plus software, a computer-controlled optical microscope with digital and analog still and video cameras, a cryostat, and a stepper stage to characterize the strength of a superconductor`s magnetic field and, therefore, its efficiency.
To develop a direct imaging-evaluation technique for magnetic fields that is affordable and straightforward, university-research-assistant Matthew Feldman starts with an yttrium iron garnet (YIG; Y3Fe5O12) indicator film grown on a gadolinium gallium garnet substrate. The YIG film is initially covered by a reflective layer of aluminum and then by a protective coating of silicon nitride or titanium nitride.
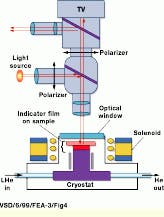
The side with the indicator film is placed down on the superconductor material, and both are placed in a custom-made liquid-helium cryostat built by Anatolii Polyanskii while at the Institute of Solid State Physics (Charnogolovka, Moscow, Russia). A window built into the cryostat allows a Nikon Inc. (Melville, NY) modular optical microscope to collect the reflected light from the indicator film. The cryostat also holds a temperature-sensing diode and a LakeShore (Westerville, OH) DRC-93CA temperature controller, which is not controlled by the system host computer.
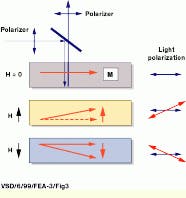
The light from a source is polarized as it enters the microscope and is then reflected downward toward the sample (see Fig. 2). A copper coil surrounding the sample-holding chamber induces a magnetic field of up to 1200 Gauss and causes the YIG indicator layer to change its polarization vectors based on the field flux induced in the superconductor layer below.
This light returns along the microscope`s optical path, passes through a second polarizer, and then enters a splitter. Next, it reaches both a Sony Electronics (Park Ridge, NJ) Hyper HAD 640 x 480-pixel color video camera with a standard NTSC output and a thermoelectrically cooled digital Photometrics Ltd. (Tucson, AZ) Sensys monochromatic camera with a 1158 x 864-pixel resolution (see Fig. 3).
Video chain
The 24-bit color image delivered to the Sony video camera travels along an S-Video cable (NTSC) to a video cassette recorder (VCR). From the VCR, another S-Video cable carries the image to a TV monitor while a third S-video cable carries the image to a Matrox Imaging (Dorval, QC, Canada) Meteor frame grabber. Because neither the application nor the Image Pro Plus software package with a Scope Pro add-on module used at the university`s ASC require preprocessing, the frame grabber only performs analog-to-digital (A/D) conversion.
Similarly, the Integral Vision (Farmington Hills, MI) PCI board that comes with the Photometrics Sensys digital camera bridges the gap between the camera and the PC host for the 12-bit gray-scale digital image. Although the Image Pro Plus software running on the PC controls the camera operations, such as gain and shutter, this configuration does not provide for VCR and TV-monitor control.
The Image Pro Plus software, through the Scope Pro plug-in module, also controls the movement of the x-y stage and its mounted cryostat. This control is important to researcher Feldman for taking spatial measurements between image areas of interest. For spatial calibration, such as determining the size of a feature or between features, Feldman takes an image of a ruler that is 1 mm long and divided into 100- and 10-μm segments. The system image from either the Sensys or HAD color camera enters the PC, gets processed by the software, and is displayed on the PC monitor.
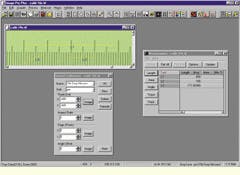
To calibrate spatial measurements, Feldman draws a line from one point on the ruler to another using the spatial calibration dialog tool and defines the line as a set distance (see Fig. 4). The Image Pro Plus program determines the number of pixels along the line and then automatically converts the pixels to physical units when taking distance measurements.
According to Media Cybernetics software developer and chief technology officer Jean-Paul Martin, Image Pro Plus with Scope Pro can automatically duplicate the same function without the ruler if it knows what each step of the stage represents in linear distance. These data are automatically programmed into the software by Scope Pro if the stage is one of the many off-the-shelf components supported by the program or is manually programmed by opening the Scope Pro configuration menu and entering the measurements representing the distance per step.
Using the spatial calibration tool, Feldman can also scan a micrograph and return to a particular position through the use of Image Pro Plus` customizable macro function tool. Indeed, Feldman has created two special macros that record a position and then automatically return the stage to the location at a later time. According to Media Cybernetics` Martin, macros will not be necessary for this function in Scope-Pro Version 4.0 because the software will remember the x-y stage location and return to that position upon operator command.
Macro functions
According to Martin, a program that is basically composed of plug-in modules lies below the small executable program and user interfaces. On a basic level, operators can create macros (recordings of key strokes) to access many of the programs in the HAIL (Halo Advanced Imaging Libraries) or they can use the Software Development Kit (SDK; Version 4.0) to create custom plug-ins that string together one or more image-processing tasks.
With this software, Feldman is able to accomplish basic tasks, such as a line measurement, with minimal set-up time. More-complicated spatial measurements such as counting blobs or determining blob areas require filtering and edge-detection techniques. By using the SDK, says Martin, users can apply several common edge-detection and filter techniques, such as tophat, erosion dilation, opening, closing, and watershed, or customize morphological kernels. Using a built-in caliper tool, the software can also be used to determine axis lengths, angles between objects, and other measurements.
At the ASC, a single magneto-optical image can cover several hundred microns of the superconductor sample. However, an individual sample can occupy up to 1 cm2. Therefore, Feldman programs the software to scan across an entire sample with roughly a 100- to 1000-μm overlap, depending on the magnification. He then takes each image and manually stitches the images together to form a complete image of the sample. Because the Image Pro Plus software permits the designation of each image with a transparency factor, Feldman can see one image through another, allowing seamless stitching of multiple images.
3-D representations
After forming the entire image, Feldman searches for the strength of the magnetic fields residing inside the superconductor material. Because the indicator film is sensitive to the magnetic field inside the superconductor that is beneath it, the optical intensity is linearly proportional to the intensity of the magnetic field. In other words, where the image is bright, the magnetic field is relatively strong.
To transfer the optical image into a magnetic-field reading, Feldman uses another macro and the intensity-calibration feature (see Fig. 5). First, the image is converted to a 12-bit gray-scale value (obtained from the Sony color camera). Feldman then uploads a nonlinear quadratic intensity calibration curve that shows the relationship between the optical and magnetic-field intensities. To calibrate the image, he selects several points on the image and uses a piece-wise polynomial fit technique. Via Image Pro Plus`s free-form calibration, the software applies six or seven points to the calibration curve, determines the relationship between a pixel intensity value and the magnetic field value, and then applies this value to all the pixels within the image.
Feldman saves the original image to the computer hard drive for later access or to the Plextor Plexwriter (Santa Clara, CA) compact-disk writer. The magnetic-field data are saved as an ASCII file and are transferred over a 10BaseT Ethernet network via a 3COM (Santa Clara, CA) EtherLink XL TPO card to a Hewlett-Packard (Palo Alto, CA) Unix workstation running MathWorks (Natick, MA) Matlab software. Feldman uses this software to create a 3-D plot of the magnetic field using Image Pro Plus numeric values. The resulting plot is then saved as a TIFF file and sent back to the PC for storage and later retrieval.
FIGURE 1. Using computer-controlled optical microscopy technology, university researchers are characterizing the magnetic field of superconductor materials as a measurement of resistance.
FIGURE 2. The in-plane polarization vector of the indicator thin film, YIG, undergoes changes based on the magnetic field of a superconductor material. This thin film is placed on top of the superconductor layer, and both are then placed in a specially designed cryostat. Once cooled, an optical microscope using two quarter-wave plates captures the intensity image created by the change in polarity in the YIG layer. This image indicates the roughly linear relationship to the magnetic field below and, therefore, the efficiency of the superconductor under test.
FIGURE 3. The Photometrics Sensys digital camera is attached to a side-port in the microscope and connects to an Integral Vision PCI card installed in the host computer. A standard S-Video cable connects the analog Sony color video camera on top of the microscope to a Sony SL V-41000 SVHS videocassette recorder VCR. Another cable is connected to a Matrox Imaging Meteor frame grabber.
FIGURE 4. The Image Pro`s software spatial calibration allows the operator to define a relationship between pixels and physical units that can then be translated to any object on the image. During definition, the operator draws a line from one point on the ruler to another using the spatial calibration dialog tool to establish the line as a set distance. The software then determines the number of pixels along the line and automatically converts the pixels to physical units when taking distance measurements.
FIGURE 5. In magneto-optical microscopy, Image Pro converts the pixel-intensive gray-scale value to a magnetic field unit through an operator-programmed polynomial equation. This equation is automatically constructed using point sampling and is accessed through the software`s free-form calibration dialog screen.
Company Information
Hewlett-Packard Co.
Palo Alto, CA 94304
(650) 857-1501
Fax: (650) 857-5518
Web: www.hp.com
Institute of Solid State Physics
Chernogolovka
Moscow 142432
Russia
Web: www.issp.ac.ru
Intel Corp.
Santa Clara, CA 95052
(408) 765-8080
Fax: (408) 765-6284
Web: www.intel.com
Lake Shore Cryotronics Inc.
Westerville, OH 43082
(614) 891-2244
Fax: (614) 818-1600
Web: www.lakeshore.com
Matrox Imaging
Dorval, Quebec, Canada H9P 2T4
(514) 685-2630
Fax: (514) 822-6273
Web: www.matrox.com
Medar Inc./Integral Vision Division
Farmington Hills, MI 48335
(248) 471-2660
Fax: (248) 615-2971
Web: www.medar.com
Media Cybernetics
Silver Spring, MD 20910
(301) 495-3305
Fax: (301) 495-5964
E-mail: [email protected]
Nikon Inc.
Melville, NY 11747
(516) 547-8500
Fax: (516) 547-0306
Web: www.nikonusa.com
Photometrics Ltd.
Tucson, AZ 85706
(520) 889-9933
Fax: (520) 573-1944
Web: www.photomet.com
Plextor Corp.
Santa Clara, CA 95054
(408) 980-1838
Fax: (408) 986-1010
Web: www.plextor.com
Quantum Corp.
Milpitas, CA 95035
(408) 894-4000
Fax: (408) 894-5619
Web: www.quantum.com
Seagate Technology Inc.
Scotts Valley, CA 95066
(831) 438-6550
Fax: (831) 438-7528
Web: www.seagate.com
Sony Electronics Inc.
Park Ridge, NJ 07656
(201) 930-1000
Fax: (201) 358-4058
Web: www.sel.sony.com
The MathWorks Inc.
Natick, MA 01760
(508) 647-7000
Web: www.mathworks.com
3Com Corp.
Santa Clara, CA 95052
(408) 326-5000
Fax: (408) 326-5001
Web: www.3com.com
University of Wisconsin/Madison
Madison, WI 53706
(608) 263-1580
Web: www.engr.wisc.edu/ centers/asc
