Automated mammographic optical image processing identifies cancer spots
Automated mammographic optical image processing identifies cancer spots
R. Winn Hardin
Contributing Editor
Selecting patterns in a large image is not an easy task, especially when the patterns represent organic tissue and, therefore, are never quite the same. Lockheed Martin Astronautics (Denver, CO), through its spin-off company MedDetect (Denver, CO), is developing an imaging system
that leverages military target-recognition algorithms, neural networks, and high-speed optical processors to identify breast cancer in digital mammography.
With the aid of the National Cancer Institute (Bethesda, MD), several radiologists (Dr. R. James Brenner, Tower Breast Imaging, Los Angeles, CA; Dr. Jeff Levy, Rose Medical Center, Denver, CO; and Dr. Norman Sadowsky, Faulkner Sagoff Center, Boston, MA), case studies, and breast x-rays from health-care provider Rose Biomedical Development Corp. (Denver, CO), MedDetect says it is building one of the world`s first nonmilitary, commercial optical processors. The system under development, which comprises spatial light modulators (SLMs), Fourier lenses, a high-speed camera, and a small diode laser, is expected to be capable of searching 1000, 8-bit, gray-scale 512 x 512-pixel frames per second. It is also anticipated to screen a patient`s set of mammograms in approximately one minute with a sensitivity performance that meets or exceeds that of the average radiologist, to find problems faster than previous methods, and to cost less than available systems.
Optical processors
Unlike digital-signal processors (DSPs), optical processors simultaneously search all points of an image. This totally parallel approach allows the optical processor to perform searches quicker than most commercially available DSP boards.
The optical processor setup begins with a coherent light source (usually a diode laser similar to that used in compact-disk players). Laser light passes through or reflects from a SLM that modulates the light, either by phase or intensity, depending on the SLM type. The modulated light usually represents one portion, or tile, of the total image inspection, whether for a printed-circuit board or a digitized x-ray. Then, the modulated light passes through a Fourier lens and again either passes through or reflects from a second SLM. Now, the modulated light represents a two-dimensional (2-D) function of the desired feature.
At this point, a variety of spatial filtering operations are performed, depending on the feature information stored in computer memory and written onto the second SLM. Next, the light passes through a second Fourier lens, reconverts the product of the two transforms, and delivers the resulting image to a high-speed detector.
Working with the radiologists, the MedDetect and Lockheed Martin team has identified 53 features that are important for screening mammograms. These features focus on size, shape, and relative density of image-detected masses and the pattern of spicules, or spoke-like lines, that radiate from the mass center. A second search routine finds and analyzes microcalcifications, which are small 40-μm-wide bright spots in the mammogram that look like small star constellations.
The team began by training a two-tiered neural network on a Hewlett-Packard (Palo Alto, CA) workstation. Mammogram film was scanned into the system via an off-the-shelf laser digital scanner with 35-μm resolution. Once digitized, the images were transported across an Ethernet network and fed into an image-analysis software system, which initially determined several image metrics such as histograms and average brightness.
Each mammogram image is tiled into 512 x 512-pixel segments at 50-μm resolution. Optical-signal-processing technology searches for the bright microcalcification on the 6k x 6k-pixel image by means of a wavelet-filter search algorithm developed by the University of South Florida (Tampa, FL) and licensed by MedDetect. Once these bright spots are found, the software operates to define groupings. Then the "constellations" of bright spots are analyzed to serve as one input to the final decision of the likelihood of cancer.
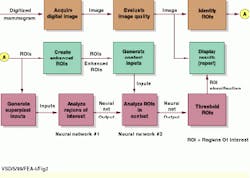
A second search routine looks for the 53 defined features when screening for cancerous masses (see Fig. 1). During this search, the initial 6k x 6k-pixel image is reduced in resolution because mass features are considerably larger and, therefore, do not require the image`s highest resolution, Lindell says. Software representing the two neural networks then takes over. The first neural network examines the regions of interest (ROIs) defined in the 512 x 512-pixel tiles that contain at least some of the 53 features.
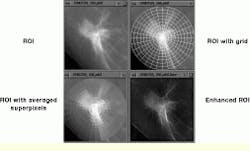
During the optical filtering process, the tiles are both filtered and searched for potential ROIs. Software running in parallel then takes the ROIs and determines the contextual data and also overlays the ROI with an electronic grid (see Fig. 2). Pixels within the grid are averaged to reduce the data flow into the neural network.
"The grid minimizes the number of inputs into the neural network," explains Lindell.
After these superpixel ROIs are generated, they are fed into the neural network, where they are identified and prioritized based on previously acquired experience from radiologists and pathology reports as to which groupings of features are likely to result in a cancerous mass. If the numerical likelihood of cancerous growth on a given image tile or set of tiles exceeds a given threshold, those tiles are passed on to a second neural network. Here, the remainder of the 53 features are taken into account along with raw pixel data from the mammogram, contextual information of the surrounding tissue, enhanced ROIs, and the screening results of an orthogonal view. This process is done independently on each of the four images that make up a complete breast screening.
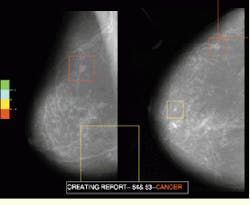
Based on the groupings and the context of the surrounding tissue and the orthogonal view, the second neural network derives a likelihood of cancer present for each ROI. For demonstration purposes, the likelihood of cancer present in different ROIs is represented by overlaying a color-coded symbol on the entire appropriate scanned area in the mammogram image and displaying it on a Silicon Graphics (Boulder, CO) workstation.
According to Lindell, training the neural network is crucial. "When we train our proprietary network, the system never sees the same data more than once, and it is never tested on the data it was trained with," explains Lindell.
This methodology, called recursive error minimization, was developed by Lockheed Martin for military purposes, and it has been tested by several medical groups, including the Mayo Clinic (Minneapolis, MN), Lindell adds. During blind tests, the MedDetect system has achieved results that are statistically the same as those achieved when testing with the existing MedDetect database of mammogram cases. The sensitivity achieved during these blind tests can be set to 100% but with a trade-off in specificity performance.
"For the tests run, we can achieve 100% sensitivity for detecting cancerous masses with approximately 0.7 false positives per image. Obviously, sensitivity must be extremely high so we don`t miss any cancers; however, low specificity is also very important. We don`t want radiologists getting fed up with the system because it alerts them too frequently to nonproblems. They will just turn the system off if that happens," Lindell declares.
Upgradeable approach
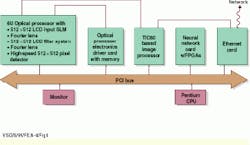
Currently, MedDetect is planning to build a prototype PC-based optical- image-processing system for commercial use (see Fig. 3). The automated mammography-analysis system requires five cards: an input/output (I/O) or Ethernet card to access the 6k x 6k-pixel digital x-rays from an Internet line or directly from a digital x-ray machine; a proprietary optical processor card; an electronic driver card for the optical processor; and two image-processing cards built along the lines of the Texas Instruments (Dallas, TX) TIC60 DSP. The second image-processing card will house daughter EPROM field-programmable-gate-array modules for the two neural networks.
In operation, the digital image enters the host through the Ethernet card and is passed through a dedicated cable to the first image-processing card. This card tasks the image metric measurements while the image is being received. It then tiles the image into 512 x 512-pixel segments at full resolution and feeds the tiles into the optical processor driver card via a dedicated cable capable of transmitting 0.5 Gbit/s.
An on-board buffer memory holds the tiles before feeding them into the first SLM. An optically optimized version of a wavelet optical filter for microcalcification is then fed into the SLM filter. The resulting filter operations detected by the CCD sensor are directed back into the image-processing board, which thresholds the bright spots and passes acceptable image data across the PCI bus to software running on the Pentium processor. This software estimates the likelihood of cancer based on the groupings of microcalcification spots in one or more tiles.
After this step, the image-processing board reduces the resolution of the 6k x 6k-pixel image by a factor of six, tiles the results into 512 x 512-pixel segments, and sends them via a dedicated cable to the optical processor driver board. The 53 features indicative of cancerous masses, which are loaded from the PC`s hard drive into the optical processor driver card at system start-up, are fed to the SLM filter through a dedicated cable. Each tile is searched for each of the features. The resulting filter operations detected by the CCD are passed through a separate dedicated cable back to the first image-processing board.
Lockheed Martin has built a 6U PCI optical processor card, complete with driver and memory buffer electronics, for two imaging systems: an industrial semiconductor inspection system and the mammography application. MedDetect developers are currently testing ferroelectric liquid-crystal SLMs from Boulder Nonlinear Systems (Lafayette, CO) and Displaytech (Longmont, CO) in conjunction with high-speed, 1000-frame/s CCD detectors from EG&G Reticon (Sunnyvale, CA) and Dalsa (Waterloo, Ontario, Canada). "The detector is always the bottleneck in this system," Lindell states.
In its final configuration, the optical processor will take up two PCI slots in a Pentium PC. One card will house the SLM, Fourier lenses, light source, and detector. The second card will contain custom driver electronics and buffer memory to feed the 512 x 512-pixel tiles to the SLM board. "What we`re talking about is an 80-Gflop math processor that can perform all the niche image-processing functions on one or two cards," Lindell says.
After the optical processor board conducts each filtering task, the resulting filter operations are fed directly back to the image-processing board. As each filter operation is fed from the CCD to the image-processing card, the card checks to see if the results hold any image data. If so, it determines which filter produced the resulting image. It then tables that information with location identifiers and passes the data onto the second image-processing card, which contains the neural networks.
The neural networks perform data analysis and evaluate the likelihood of cancer based on the types of features found and their groupings. After two mammograms are analyzed, ROIs are thresholded, classified, and passed to the PC for display (see Fig. 4).
According to Lindell, the system design team is still surveying radiology data to develop the best type of graphical interface. A final product may offer doctors options about how they would like to see the images displayed. "Doctors aren`t used to using computer screens to look at mammograms, but as digital x-rays become more accepted in the near future, that will change. So in the near term, it is likely that our display or printout will be used by the doctor as a cueing mechanism back to the film," says Lindell.
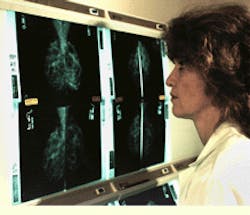
Radiologist at Rose Biomedical Development Corp. (Denver, CO) reviews input x-ray mammograms prior to digitization and computer analysis.
FIGURE 1. Digital images are tiled and fed into the optical processor at the "identify ROIs" box. From the unenhanced ROIs, the algorithm overlays an electronic grid on the ROI and averages the pixels to reduce the data flow into neural network #1. This network analyzes ROIs containing a subset of the 53 mass-indicating features. Masses that meet minimum criteria are passed into the second neural network that evaluates the ROIs for the remaining features combined with contextual data and the enhanced ROI. This second neural network thresholds the ROIs that meet minimum requirements and passes them to the display and the physician.
FIGURE 2. Optical processing filters the digital mammogram data to provide both ROIs and enhanced ROIs. Before the data can be analyzed by the neural network, however, the algorithm averages the pixels based on a concentric grid. Then, if the superpixel image data meet minimum cancer critera, an enhanced ROI is displayed.
FIGURE 3. MedDetect plans to use a PC host system for its commercial mammogram-analysis system. The final 6-U optical processor card will fit into two slots on the PCI board. Most of the image data passed among the boards, however, is sent via dedicated cable to make the most of the speed of the optical processor.
FIGURE 4. Red, green, and blue color codes tell radiologists the location and potential for breast cancer in a typical mammogram.
Company Information
Boulder Nonlinear Systems
Lafayette, CO 80026
(303) 604-0077
Fax: (303) 604-0066
Dalsa Inc.
Waterloo, Ont., Canada N2V 2E9
(519) 886-6000
Fax: (519) 886-8023
Web: www.dalsa.com
Displaytech Inc.
Longmont, CO 80503
(303) 772-2191
Fax: (303) 772-2193
EG&G Reticon
Sunnyvale, CA 94086
(408) 738-4266
Fax: (408) 738-3832
GE Medical Systems
Waukesha, WI
(414) 798-4401
Fax: (414) 798-4573
Hewlett-Packard Co.
Palo Alto, CA 94304
(650) 857-1501
Fax: (650) 857-5518
Web: www.hp.com
Intel Corp.
Santa Clara, CA 95052
(408) 765-8080
Fax: (408) 765-6284
Web: www.intel.com
Lockheed Martin Corp.
Bethesda, MD 20817
(301) 897-6000
MedDetect
Denver, CO 80220
(303) 320-2998
Rose Biomedical Development Corp.
Denver, CO 80220
(303) 320-2594
Fax: (303) 333-7511
Siemens Corp.
New York, NY 10019
(212) 258-4000
Fax: (212) 767-0580
Web: usa.siemens.com
Silicon Graphics Computer Systems
Boulder, CO 80302
(303) 938-6800
Texas Instruments Inc.
Dallas, TX 75266
(972) 995-2011
Web: www.ti.com
University of South Florida
Tampa, FL
Web: usfweb.usf.edu/
