Low-temperature crystallography renders high-resolution images
Low-temperature crystallography renders high-resolution images
By John Haystead, Contributing Editor
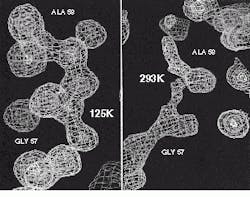
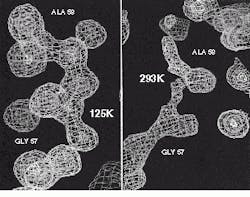
Mapping the structure of complex molecules such as proteins can aid researchers looking for cures to cancer, Alzheimer`s disease, and cardiovascular disease. To do so, scientists at Lawrence Livermore National Laboratory (LLNL; Livermore, CA) are using low-temperature x-ray crystallography techniques to obtain accurate images of molecules. By cooling crystallized molecules at low temperatures, free radicals generated from the crystals under test are reduced, increasing the system`s signal-to-noise ratio and allowing more accurate maps to be generated (see Fig. 1).
Before structural analysis, proteins or DNA fragments are crystallized and then cooled in liquid nitrogen (at 77 K) using a modified LT-2 cryocooler from Siemens (Madison, WI). After mounting on a goniometer, the crystal is oriented relative to the x-ray beam source. A graphite monochromator focuses 1.54 Å x-rays produced by a RU200 rotating anode generator from Rigaku (Danvers, MA) onto the crystal.
When x-rays strike the crystal, the angular extent to which they are diffracted determines the minimum spacing at which features in the molecule can be resolved. Resolution limits for protein crystals are between 1.5 and 3.5 Å. In addition, the intensity of each diffracted beam is determined by the location and type of atoms within the crystal. Knowledge of the diffraction pattern allows computer-reconstruction of the crystal structure.
Detector types
Lawrence Livermore National Laboratory uses two types of detectors to collect diffracted x-rays. One system uses a pair of large-area multiwire detectors manufactured by Area Detector Systems Corp. (ADSC; Poway, CA). These detectors are filled with xenon that is ionized by incoming x-rays. Under an applied electric field, resulting ions and electrons create a cascade of charge that is proportional to the x-ray intensity onto a 256 ¥ 144 x-y multiwire grid. Pixel sizes of 2 and 1.2 mm can be measured in vertical and horizontal directions. The spatial position of the diffracted beam is determined from the position on the x-y grid.
"Although there is a charge associated with the grid, the detector functions as a photon detector, quantizing the presence of individual events. Detector thresholds are set so that active events are discriminated from noise," says Chris Nelson, ADSC`s software development manager.
Given the large size of the pixels on the multiwire grid, the detector needs to be positioned far enough away from the crystal for the spots to separate from each other enough for accurate sampling. Because air absorbs x-rays of this energy, helium-flushed boxes are placed between the detectors and crystal sample.
LLNL is updating this technology with an ADSC CCD detector. In this system, x-rays strike a phosphor on the surface of the detector, converting the energy into visible light. Light is then focused using a fiberoptic taper onto the CCD. This CCD is controlled by a Pentium 133 PC running Windows 3.1. Readout rates for the images are from one to nine seconds, depending on the analog-to-digital converter mode. Because crystals are frozen, exposure times can be extended to increase data accuracy.
CCD advantages
"CCDs offer a number of advantages over multiwire grids. With 1152 ¥ 1152 pixels on a single 25.9-mm CCD chip, the CCD provides better spatial resolution and can be placed closer to the crystal, shortening the x-ray`s path through the air and eliminating the need for helium boxes," says Nelson. Compared to the multiwire detector, the CCD can collect more or better-quality data in a given time. "The combination of enhanced cryocooling, focusing mirrors, and CCD detectors can reduce collection time by a factor of about eight. Consequently high-quality data can be obtained within hours or days compared to days or weeks," adds Nelson.
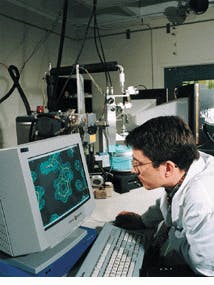
To digitize a complete diffraction pattern, a series of x-ray images is taken of crystals as they rotate in small angular increments. Image frames are collected sequentially and processed to produce a dataset consisting of positional information, intensities, and background levels for each diffracted beam. Further processing involves scaling and merging of equivalent data into a final list of indexed reflections. All of the processing is controlled and recorded in real time by a R3000 workstation from Silicon Graphics (Mountain View, CA), which displays diffraction patterns on screen (see Fig. 2).
Solving structures
When x-rays interact with electrons, outgoing diffracted beams are phase-shifted with respect to the primary beam. Luckily, methods are available to estimate phase information. One technique, called multiple isomorphous replacement, involves chemically modifying the protein crystal by adding heavy metal atoms. Comparison of the differences in diffraction patterns for a series of different heavy atom derivatives allows phase information to be deduced. Other methods include multiwavelength anomalous diffraction, in which phase information is obtained by comparison of diffraction data collected at different wavelengths, and molecular replacement, in which phase estimates are obtained from previously determined structures that are known to be similar.
To reconstruct an electron density image, phase angles must be assigned for as many as 5-100k data points. After a preliminary set of phase information for the x-ray data has been calculated, the dataset is transferred to Indigo II and R4000 computers from SGI over an Ethernet network. LLNL`s Ethernet network is managed by a Windows NT 3.51 dual Pentium server linking ten SGI workstations and ten Windows 3.1/NT PCs. The server also runs an anonymous FTP site and provides a daily network backup of about 40 Gbytes.
Molecule building
XtalView software, written by Duncan McRee of the department of molecular biology at Scripps Research Institute (La Jolla, CA), runs on the SGI workstations. This software converts diffraction data into electron density maps that can be manipulated in three dimensions. XtalView`s "skeletonization" feature compresses the electron density image into a pattern of lines that trace the core of the electron density.
The initial electron density map is usually a poor first estimate of crystal structure. "At this point, the phase angles are not well defined, and the map has a lot of noise showing features that shouldn`t be there or are missing, says Nelson. As the electron density map is analyzed on the workstations, these problems must be identified and corrected.
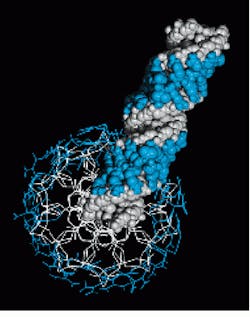
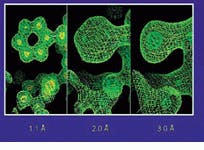
In protein molecules, fragments of amino-acid building blocks can be inserted and pieced together to fit the electron density map. Refinement of the structure requires making the best fit between models and diffraction data (see Fig. 3).
"It`s a long process, going back and forth between `real space` (electron density) and `reciprocal space` (diffraction pattern)," says Nelson. In reciprocal space, SHELXL, written by G. Sheldrick of the University of Göttingen (Germany), and X-PLOR, written by A. Brunger of Yale University (New Haven, CT), refine the atomic coordinates and vibrational parameters of molecular models to minimize the difference between experimental and calculated diffraction data. XtalView allows manipulation of molecular fragments in real space.
FIGURE 1. Comparison of equivalent regions in a macromolecular structure: left, flash-cooled to 125 K; right, recorded at room temperature.
Scientists at Lawrence Livermore National Laboratory are using cryogenic x-ray crystallography to map the structures of complex molecules.
FIGURE 2. Lawrence Livermore Laboratory crystallographer Sean Parkin inspects an atomic resolution electron density image of a tryptophan amino acid in the protein subtilisin.
FIGURE 3. Atomic detail can be observed at high resolution. A model of phenylalanine (the 6-ring structure) can be placed
correctly into the 1.1 Å data. However, at lower resolution, discrepancies between the model and the electron density may exit.
