Reconstruction software anD electron microscopy visualize deadly diseases
Reconstruction software anD electron microscopy visualize deadly diseases
By R. Winn Hardin, Contributing Editor
Although they are not living organisms and are unable to replicate on their own, viruses induce major detrimental health effects worldwide. For example, the World Health Organization (Bethesda, MD) estimates that 30 million people have been infected with HIV since the 1980s, resulting in approximately 9 million deaths.
In efforts to obtain visual images of viruses, the design, development, and application of electron microscopy has been greatly expanded in biological and material sciences. And, as a result, new software tools are adding to the power of these machines and making it easier for all
branches of science to explore molecular structures in the medical search for remedial answers.
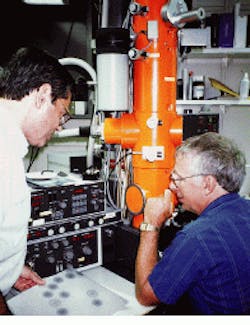
At the US National Institutes of Health (NIH) and Argonne National Laboratory (Argonne, IL), researchers Alasdair Steven and Benes Trus and their colleagues are using electron microscopy to explore the proteins that form icosahedral capsids, the containers of viral nucleic acid (see Fig. 1). Using electron microscopy, parallel-processing computers, and commercial and specialized software, they are mapping viral-type structures in three dimensions, thereby learning about the specific proteins that form these genetic carriers of disease and giving other scientists crucial information that may lead to vaccinations or better drug treatments.
Electron sources
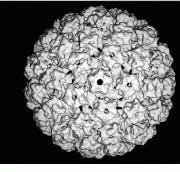
The NIH facility uses a CM 200 FEG (field-emission gun) electron microscope from FEI (Hillsboro, OR), a company now affiliated with Philips Electronics (Eindhoven, The Netherlands) through the acquisition of Philips Electron Optics, and a Zeiss (Thornwood, NY) 902 electron microscope. According to Steven, the CM 200 FEG offers the most coherent source of electrons and the highest resolutions for molecular imaging at NIH. For example, this machine has produced the highest-resolution electron micrographs (9 Å) of a protein within the Hepatitis-B virus and of bovine papillomavirus (9 Å see Fig. 2).
Prior to observation, molecular samples are rapidly frozen to trap them in a thin layer of vitreous ice, preserving their fragile structures. This technique, called cryoelectron microscopy, was developed in US and European laboratories during the 1980s and is now reaching maturity, according to Steven. It represents a major advance over earlier techniques that required the specimen to be dehydrated, which distorted its native structure, and then to be contrasted by adding heavy metals as stains or by evaporation. In cryoelectron microscopy, the density of the molecules themselves-proteins and nucleic acids-generates their images.
The NIH uses transmission electron microscopes (TEMs) to measure the electrons that pass through the sample. An electron source, often a field-emission gun in the highest-resolution machines, directs a stream of electrons through a hollow column of electromagnetic rings that act as electron lenses. This stream then passes through the sample and impinges on a phosphorescent screen, giving off green light. After a satisfactory image is generated, the scientist removes the screen, allowing the stream to impact a sensor/storage medium.
In the NIH TEM, electrons are either captured by a special 3.25 ¥ 4-in. silver halide film from Eastman Kodak (Rochester, NY), which is later scanned by a Perkin-Elmer 1010 MG (Norwalk, CT) 16-bit CCD-based scanner, or directly by a 14-bit high-definition phosphor scintillator/CCD camera from Gatan (Pleasanton, CA).
The film and direct-to-digital recordings offer different advantages, depending on the type of measurement, electron energy, and resolution. "The CCD is still a technical generation away from supplanting film in high-resolution cryomicroscopy," says Steven. "Film is more sensitive and has a much-higher data-carrying capacity. The process really has to do with improving the quantum detection efficiency--we have to make every electron count because the specimens we look at are very sensitive to radiation damage."
Researcher Ming Pan at Gatan admits that sensitivity is a major issue for biological applications. However, the Gatan camera offers both high sensitivity and software designed for low-dosage applications. Another camera vendor, Princeton Instruments (Trenton, NJ), also offers intensified and backlit CCDs with considerably higher quantum efficiencies than those obtained from standard detectors.
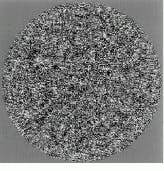
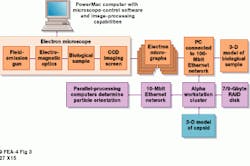
The resulting digital file is then converted to a custom byte format (or saved as a TIF or PICT file) for image processing. It is next shipped to a Digital Equipment Corp. (now Compaq Computer Corp., Houston, TX) 500-MHz Alpha workstation cluster via a 100-Mbit/s Ethernet file-transfer protocol (see Fig. 3). On the Alpha workstations, the researcher chooses the best eight bits for processing and isolates individual capsids measuring from 127 ¥ 127 to 351 ¥ 351 pixels from the original 5000 ¥ 7000-pixel image. This procedure results in 50 to 500 capsid images per micrograph. NIH`s Trus adds that there is no limit on the size of the capsid image packet; "It`s just that we haven`t had the need to go above 350 so far."
The capsids are stored in a single file either on 9-Gbyte disks or on 7 ¥ 9-Gbyte RAID disks for faster input/output (I/O). The Alpha workstations are connected to a fiber distributed-data interface (FDDI) fiberoptic network. After preprocessing, researchers must determine each capsid`s orientation. This is done by using a series of batch programs on either an IBM Corp. (White Plains, NY) SP2 or Silicon Graphics Inc. (Mountain View, CA) Origin parallel-processing supercomputer. After the images are transferred from the Alpha workstations to the parallel-processing computers via a 10-Mbit/s Ethernet network and the batch program processing are completed, the images are combined into a single three-dimensional (3-D) model at a very high signal-to-noise ratio (S/N) (see Fig. 3, inset). As a result of improvements in processor speeds and interchip communications in supercomputers, processing and combining the many hundreds of these individual images into a 3-D model take much less time.
"Originally the process took a month of Digital Equipment VAX CPU time and three months of human time to process the results. Now we get a result in a few days," Trus says. Computer technology at the NIH/ Center for Information Technology (CIT) image-processing research section has evolved from the Digital Equipment VAX/VMS system to a 128-processor Intel Corp. (Santa Clara, CA) IPSC/860 multiple-instruction, multiple-data parallel-computer environment and Compaq Corp. 500-MHz Alpha Deck computer, and then to the IBM SP2 and SGI Origin parallel-processing computers.
Search engines
Because each image contains symmetrical 3-D information projected onto 2-D space, image-processing software must decipher the capsid`s 3-D orientation before combining the hundreds of individual images into a coherent 3-D model. Each icosahedral capsid is composed of 20 identical triangles (faces) and 12 facets. An icosahedron contains threefold symmetry (at the center of each face), fivefold symmetry (along each facet), and twofold symmetry (at the center of each edge). These symmetries create common lines of information in a given image that depend on the particular orientation of the virus capsid.
A series of seven software programs developed by the NIH/CIT must determine the orientations of each capsid before combining the images into a single 3-D model. By searching for common lines viewed or rotated along 384 different possibilities, the program series helps to determine the most likely orientation for each particle. These steps are generally conducted in Fourier space, Trus says, as a matter of computational efficiency and expediency.
The first software program, Findview, generates a set of 10 to 40 `best` orientations for each image. The researcher reviews the computer`s orientations or passes them directly into the second software program for verification. Trus says that experience helps the researcher determine which are the most likely orientations for six to nine images. These comprise a "basis set" necessary for further processing.
Trus adds that the researcher can opt for computer verification of whether the most likely orientation for a given image is the correct one. The second program, called Local Refine, determines whether a given orientation is correct by comparing one image against other capsids and searching for mutual consistency. It compares the remaining images not included in the basis set from the Findview program against the basis set. This step determines the most likely orientations for the remaining capsids. If the assumed orientation of the new image is incorrect, then this step will not be successful, and errors or residuals will be high, he says, telling the researcher to try another orientation solution for the particle from the best list. If no satisfactory orientation solution is obtained for a given capsid from the best list, then the capsid is discarded.
The third program, called Global Refine, simultaneously compares all the satisfactory capsids against each other. When the researcher mixes many images together [in Global Refine], not only must the individual symmetry constraints be satisfied (for example, common lines), but the relationship between multiple images (called cross-common lines) must also be consistent, says Trus. "So it falls out very quickly which [orientations] are correct. It`s an extremely constrained situation," he adds.
Once the orientations of the many capsids are known, the computer can begin to combine the images into a coherent 3-D model. The next four programs--Merge, Invert, Bessel, and Map--make up the 3-D reconstruction phase of the software. These programs make use of Bessel Fourier space to reduce the amount of data to one-fifth the size of the previous refinement programs by taking advantage of the fivefold symmetry of the icosahedral capsid structure. In the final step, called Map, the Bessel functions are converted to Cartesian space to create the 3-D model.
Although only applicable for icosahedral structures, the software series has also been useful for imaging asymmetric structures such as DNA strands inside a capsid. This is accomplished by obtaining a 3-D structural model with maximum S/Ns and subtracting away the outer protein structure from individual raw 2-D images, thereby revealing the DNA inside. Of course, the orientations of the raw images must be known to be able to reproject the capsid shell in the same orientation for subtraction.
Algorithms save time
A new algorithm called the Polar Fourier transform (PFT), which was developed at Purdue University (West Lafayette, IN) in 1996, greatly reduces the time required for the second step in 3-D reconstruction--the refinement process (both Local and Global Refine). It works more efficiently in Polar Fourier space because a PFT is rotationally invariant. The PFT takes advantage of a capsid`s spherical shape by eliminating the need for determining the angular or rotational differences between two capsids (although it must still know the location of the center of each capsid). It also replaces Findview when the structure of a similar type capsid has already been studied, and the researcher (and, therefore, the computer) has some idea of the structure.
"The Polar Fourier transform has revolutionized the reconstruction process because it is easier to use, more accurate, and not as indeterminate," Trus says. In addition, PFT can be used to refine either less symmetric objects, or even objects with no symmetry. By incorporating the work accomplished by researcher Raisa Freidlin, the PFT code has been ported to both the IBM SP2 and SGI Onyx 2 parallel-processing computers with eight processors. Researchers are currently evaluating which computer architecture is most suitable for this problem, and they are considering alternative parallel strategies to obtain the most efficient results.
The NIH work is pushing the envelope of electron microscopy and image-processing. Electron microscopy is one of two main methods for obtaining the highest-resolution images of biological structures. Although it cannot yet match the 3- to 4-Å resolutions of x-ray crystallography, it does work for the large number of noncrystallizing structures important to viral and biological research. It also allows researchers to study these structures as they interact in ways that can normally be found only in one place--inside a living host.
FIGURE 1. Benes Trus (left) and Alasdair Steven at the National Institutes of Health are using a Zeiss 902 electron microscope equipped with a CCD camera to explore the proteins that form icosahedral capsids, the containers of viral nucleic acid.
FIGURE 2. Using a CM 200 FEG (field- emission gun) electron microscope from FEI (Hillsboro, OR), NIH researchers have produced 9-Å electron micrographs of bovine papillomavirus.
FIGURE 3. After the electron-microscope images are digitized, they are converted to a custom byte format and shipped to a 500-MHz DEC Alpha workstation cluster via a 100-Mbit/s Ethernet file transfer protocol. These workstations isolate the individual capsids measuring between 127 x 127 to 351 x 351 pixels from the original 5000 x 7000-pixel image. After preprocessing, researchers determine each capsid`s orientation by a series of batch programs on either an IBM SP2 or SGI Origin parallel-processing computer. Images are then combined into a single 3-D model (left).
reference
C. Lanczycki et al., "Parallel computing strategies for determining viral capsid structure by cryoelectron microscopy," IEEE Computational Science & Engineering, 76 (April-June 1998).
