Neural networks and machine vision team up to grade corn
By Philip Winter, Hugh Wood, Wade Young, and Shahab Sokhansaj
A dedicated machine-vision/neural-network food-inspection system can help maintain product quality and therefore ensure the repeated buying of a specific food product by consumers. For example, consumers who find many difficult-to-pop kernels of popcorn in a package are unlikely to remain loyal to that particular brand. Consequently, evaluating the quality of corn kernels prior to packaging becomes an important factor in achieving market success. And the evaluation process can provide the manufacturer with a reliable means to enhance popcorn quality and to recognize and eliminate undesirable kernels.
Although traditional human-eye-inspection grading methods for popcorn exist, specific guidelines, such as weight, have proved insufficient to predict quality. However, by measuring their physical and morphological features, corn kernels can be visually graded and sorted by a combined machine-vision/neural-network system. This type of visual-inspection system is well suited to examining food products such as corn kernels because it can identify and quantify features too small for the human eye to see.
Machine vision
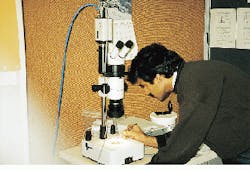
Researchers at the University of Saskatchewan (Saskatoon, Canada) have developed a machine-vision system to evaluate the quality of popcorn kernels using off-the-shelf hardware and neural-network software. The system consists of a Windows `95-based personal computer (PC) with 32 Mbytes of RAM and a Meteor frame grabber from Matrox (Dorval, Quebec, Canada). To digitize images, the red, green, and blue (RGB) color data are captured using a DXC-151A color camera from Sony of Canada (Willowdale, Ontario, Canada).
In the machine-vision system, two lighting systems are used. For extraction of color and morphological features, reflective lighting serves best. Because this lighting creates shadows from the object being imaged, an illuminated baseplate is used to increase the contrast between the background and imaged objects.
Feature extraction
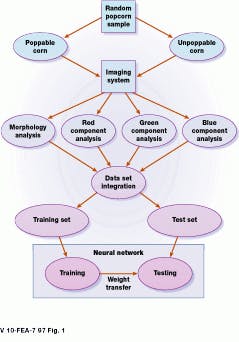
In operation, Matrox Inspector software is used for image acquisition and for extracting position-invariant features from the corn. Of the 16 features extracted, the eight morphological features are area, perimeter, convex perimeter, compactness, roughness, length, breath, and elongation. Other features extracted include mean pixel values, minimum pixel values, and standard deviation of pixels (see Fig. 1).
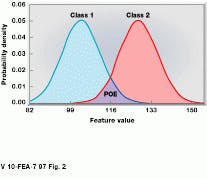
To develop an efficient recognition algorithm, the most important features of the corn must be recognized. One way to accomplish this is to use the probability of error (POE) of a feature (see Fig. 2). The POE is the area under the overlapping distribution curves for the feature. If a normal curve is fitted to the data, the overlapping area can be calculated. For pattern recognition, the distribution classes for different features should be as unique as possible, with more distinct features having a lower POE. Histograms for each feature and each class (popped corn and difficult-to-pop corn) are calculated with the same number of samples, and the same bins are used for both classes. The POE is then calculated as the sum of the overlapped points in each bin.
Ideally, a feature should have no correlation with other features. After the features are ranked by POE, a correlation matrix for all of the features can be found using a software spreadsheet such as Excel from Microsoft (Redmond, WA). The best feature is then the feature with the lowest POE, the second best feature is the feature with the lowest correlation to the feature with the lowest POE, the third best feature has the lowest average correlation to the first two, and so forth, until all the features are ranked.
Corn analysis
To analyze popcorn kernels, a random sampling of popcorn is taken from a commercial package. The corn is imaged and popped 100 samples at a time until 130 unpopped kernels are obtained.
During data extraction, the software assigns a label to each kernel. This label is then tagged to the respective kernels with a black marker. The first set of 50 kernels is then placed in a bag, another set of 50 kernels is prepared, and the feature-extraction process is repeated. The bag, containing 100 kernels, is sealed and placed in a microwave oven. After heating, the popped kernels are removed from the bag.
To ensure enough exposure time for every kernel, the bag is heated again. Kernels that are still not popped are removed from the bag, and their labels are recorded. The labels are used to separate the data gathered from hard-to-pop kernels from those representing popped kernels. Data are divided equally into a training set and a testing set. The training set is used to train the neural network, whereas the test set is used to verify the classification accuracy of a set of new data.
Pattern recognition
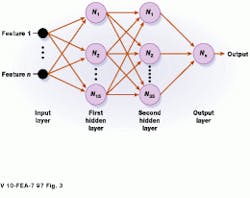
The power of a software-based neural network is its ability to learn (see Fig. 3). That is, process weighting factors, or weights, between neurons ("N," the connecting elements of the neural network) are changed until a desired output is reached for a given input.
In the popcorn application, a back-propagation method is used for training. In this iterative method, a set of features is presented to the neural network along with the corresponding desired output. The features are passed through the neural network, and an output is calculated and compared to the desired output. The weights are then changed to give the greatest decrease in error. This training process is continued until a minimum error is reached.
For pattern recognition, the Neural Network Toolbox in MatLab from The MathWorks (Natick, MA) is used to develop a network that performs a mapping operation of the inputs onto an output or decision function. The output function is often nonlinear, enabling the network to establish discrimination rules.
For example, the neurons accept "n" inputs (16 features in this case), multiply the inputs by a weighting factor W, and sum the results. The sum is passed through a nonlinear function, which provides an output between -1 and +1. For complex tasks, such as pattern recognition, many neurons are cascaded together. A common network is made up of an input layer, one or more "hidden" layers of neurons, and an output neuron.
In the popcorn application, the optimum network contains 15 neurons in the first hidden layer, 35 neurons in the second hidden layer, and one output neuron. The network is determined by examining the output of ten different-sized networks. After 75,000 training sessions, the network provided an overall 75% recognition rate for the test set of 130 kernels.
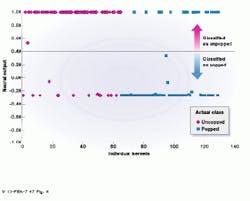
The output of the neural network is obtained by using all 16 available features for recognition (see Fig. 4). In this network, the desired output is +1 for hard-to-pop kernels and -1 for popped kernels. A secondary discriminating measure is chosen at 0.40 for a better interpretation of the output. If the neural output is above 0.40, the kernel is classified as hard to pop. If the output is below 0.40, the kernels are classified as those that could be popped.
Kernels that could not be popped are 78% correctly identified, and popped kernels are 72% correctly identified, resulting in an overall recognition rate of 75%. While this value is not a highly accurate rate, it indicates that the popping quality of the kernels is reflected by the visual characteristics of the seeds.
Further research is expected to improve the recognition rate by changing the combination number of the neurons in the first and the second hidden layers and by incorporating more features characteristic of popcorn during neural-network operations.
Philip Winter is research engineer, department of electrical engineering, Hugh Wood is professor of electrical engineering, Wade Young is research assistant, department of agriculture and biosource engineering, and Shahab Sokhansaj is professor of agriculture and biosource engineering at the University of Saskatchewan (Saskatoon, Canada).
null
null
null
Company Information
Matrox Electronic Systems
Dorval, Quebec, Canada H9P 2T4
(514) 969-6330
E-mail: [email protected]
Web: www.matrox.com
Microsoft
Redmond, WA 98052
(206) 882-8080
Web: www.microsoft.com
Sony of Canada
Willowdale, Ontario, Canada M2H 2S6
(416) 499-1414
The MathWorks
Natick, MA 01760
(508) 647-7000
E-mail: [email protected]
University of Saskatchewan
Saskatoon, SK, Canada S7N 5A9
(306) 966-5332
E-mail: [email protected]
Web: wolf359.usask.ca/phil/
