Aerial Imaging Aids Precision Agriculture
Each year, independent corn and soybean seed company Peterson Farms Seed (Fargo, ND, USA; www.petersonfarmsseed.com) researches and tests innovative methods to apply seed and fertilizer. Field conditions such as soil content and plant health must be monitored to determine input levels for each season. One method for doing so involves the use of satellite images, but new technologies like multispectral imaging and drones provide a much faster and more accurate method for doing so.
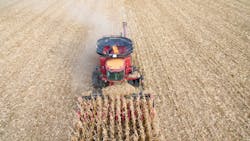
The regional corn and soybean seed company must determine input levels for seed and fertilizer. A process known as variable rate application involves using optimal amounts of seed or other inputs in certain areas of a field based on historic yield, soil health, elevation, and satellite or drone imagery. For example, if a corn field (Figure 1) has a traditional seeding rate of 34,000 corn seeds per acre, adjusting the amount of seeds that go onto areas that historically yield higher and putting less seeds in areas with lower yield makes sense, according to Nolan Berg, Precision Systems Specialist, Peterson Farms Seed.
In-season variable rate fertilization is another method utilized by Peterson Farms Seed to lower input costs while still maintaining higher yields.
“Corn takes up more nitrogen at the end of the season, so putting all the nitrogen at the beginning creates the risk of losing that nitrogen to environmental factors like rain and heat,” says Berg. “Putting a lower rate of nitrogen up front and coming in later in the season to reevaluate what the soil and corn plants look like and using a variable rate on top of that helps mitigate that risk.”
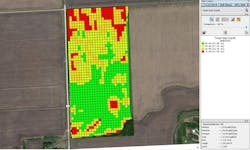
A plan for variable rate applications is known as a variable rate prescription (Figure 2). Traditionally, according to Berg, satellite images help inform variable rate applications and subsequent prescriptions.
“Satellite imagery works well for variable rate, but satellite images only come in once a week at most, or once every two or three weeks,” he says. “Putting down an immediate application requires using whatever the latest satellite image is, which may not be quite representative of what the field looks like then and there.”
By using drone-based imaging technology, the company now has the capability to zero down within inches to change prescriptions and applications in the fields, explains Berg.
“There is variability in different fields, so inputs of materials like seed and nitrogen are redistributed as needed,” he says. “Some areas of the field are poor every year, there is no point in putting high amounts of seed and fertilizer there. It’s a waste of money, so these areas are lowered and the rates in better areas of the field bump up, resulting in potentially higher yields.”
For the project, the company chose Sony Electronics Professional Solutions of America’s (Paramus, NJ, USA; https://pro.sony/agriculture) vegetation analytics platform, which includes a multispectral camera and accompanying Fast Field Analyzer offline software.
Using Sony’s system mounted onto a Phantom 4 quadcopter drone from DJI (Shenzhen, China; www.dji.com), a flight plan is created to cover a target field. Once the plan is set, the drone takes off by itself and begins capturing images of the field. Once it lands, the SD card is removed from the camera and put into a laptop for processing. With this system, a map can be generated within a few minutes after the flight without relying on any internet connection at the field.
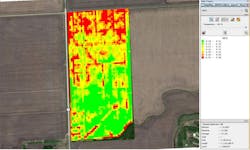
Once Sony’s FFA software generates a map, it is exported and put into Ag Leader’s (Ames, IA, USA; www.agleader.com) SMS farming software. Input data includes color drone data, along with data input layers including soil type, soil test numbers, normalized difference vegetation index (NDVI) maps (Figure 3), and multiple years of yield maps. These run through the software and average together to create the variable rate prescription management zones.
In a recent example, the drone in one day flew over several fields. By the next afternoon, Berg used both software packages to process the NDVI maps and create variable rate maps to apply fertilizer the following day. Red sections of the map showed areas of drowned-out corn with no fertilizer application. On the southern, more well-drained area of the map, the company applied more fertilizer for better yields.
“The amount of inputs used on the fields usually remains the same, but instead of wasting things like seed or nitrogen in low or no-yield areas, more fertilizer goes down in the good areas instead, resulting in higher yields.”
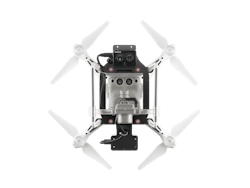
The MSZ-2100G sensor unit (Figure 4) consists of a multispectral camera and RGB camera. On the RGB side, a 12 MPixel Sony Exmor R CMOS image sensor captures aerial images, while the 2 MPixel NDVI multispectral camera unit captures images in the red and NDVI range.
NDVI is calculated as follows: near-infrared radiation minus visible radiation divided by near-infrared radiation plus visible radiation, according to NASA (http://bit.ly/VSD-NDVI):
NDVI = (NIR — VIS) / (NIR + VIS)
Most satellite vegetation indices use this formula to quantify the density of plant growth on Earth.
In addition to the Sony image sensors, the unit contains a global navigation satellite system (GNSS) sensor which provides accurate geolocation data for images. Sony’s Fast Field Analyzer software processes NDVI and RGB data plus geolocation information to produce detailed maps and enable rapid in-field analytics with no internet connection required.
“Quite a bit can be done with just a color image, but NDVI images provide a lot more scientific-grade, accurate, and repeatable data,” says Berg. “If something appears red or otherwise lower on the NDVI scale, that is an accurate representation of what is happening in the field.”
He adds, “Basically, NDVI images offer the ability to show things that cannot be seen by the human eye, while showing things like plant stress earlier than it might otherwise be found.”
When Berg first started at the company, the traditional method of applying all the planned fertilizer to the field pre-planting was employed. Positive results emerged when the team opted to switch to about 70-75% fertilizer up front and a variable rate application in-season using drone imagery. The company spent about the same amount of money on inputs such as seed and fertilizer, while increasing its overall yields.
“Bottom line, we are definitely being more efficient and hopefully using less inputs than before, while getting higher yields and ultimately increasing profitability,” says Berg.
Related stories:
Spectral imaging system enables digital plant phenotyping
Deep learning and hyperspectral imaging technologies team up for diseased potato identification
Handheld hyperspectral imaging camera measures crop health
Share your vision-related news by contacting Dennis Scimeca, Associate Editor, Vision Systems Design
SUBSCRIBE TO OUR NEWSLETTERS
About the Author

James Carroll
Former VSD Editor James Carroll joined the team 2013. Carroll covered machine vision and imaging from numerous angles, including application stories, industry news, market updates, and new products. In addition to writing and editing articles, Carroll managed the Innovators Awards program and webcasts.