Understanding oversegmentation and region merging
Understanding oversegmentation and region merging
PETER EGGLESTON
The common approaches to region segmentation are based on intensity thresholding and work well for images with homogeneous objects of interest. However, many images contain noise, texture, and clutter, all of which hamper the effectiveness of these techniques. The application of threshold-based segmentation algorithms on images with nonhomogeneous objects of interest can result in segmentation that is too coarse or too fine. These results are defined as undersegmentation and oversegmentation, respectively. Split and merge techniques can often be used to successfully deal with these problems.
Oversegmentation techniques
For some images it is not possible to set segmentation process parameters, such as a threshold value, so that all the objects of interest are extracted from the background or each other without oversegmenting the data. Oversegmentation is the process by which the objects being segmented from the background are themselves segmented or fractured into subcomponents.
Whereas oversegmentation increases the chances that boundaries of importance have been extracted, it does so at the cost of creating many insignificant boundaries. In this case, prefiltering techniques, as discussed in previous columns (see Vision Systems Design, Oct. 1998, p. 20), should be used in an attempt to eliminate noise, improve interobject definition, or smooth image textures, all of which might cause segmentation difficulties. If these techniques are not sufficient, oversegmentation can be used as a preliminary processing step, followed by grouping processes that attempt to reassemble the objects into singular image events (one object). Each segment derived from the image is referred to as an object, and the properties of the segments are designated as attributes or features.
Similarity metrics
After an image is segmented, its adjacent regions can be merged to form a less fragmented segmentation based on their similarity. Similarity metrics can be defined as a function of intensity, color, size, texture, variance, and shared border ratio, among others. In addition, for any feature, different techniques can be derived to measure similarity. For instance, the difference in intensity between adjacent objects can be measured by two methods. In one method, the average of all the pixel intensities in one object can be compared to the average intensity of all the pixels in an adjacent object. This process is termed global contrast.
Alternatively, local contrast can be computed by comparing the average intensity made up of just the pixels that are adjacent to the border between two objects. One or the other or the maximum of the two can be used. For another alternative, the size of the objects being compared could be used to select which contrast method is employed. Global contrast can be computed when small objects are being considered, and local contrast can be used for large objects.
A second method would be to select the contrast computation method based on the variance of the object intensities. Where large intensity variance exists, local contrast might be more appropriate, whereas global contrast could be used for objects that have low intensity variance.
It is the goal of a similarity function (f) to evaluate the likeness of two adjacent objects in an image. In general, the more features this function takes into account, the more satisfactory the results it produces. A similarity score can therefore be derived as a function (F) of many similarity sub-functions (fn):
Similarity Score = F (f1w1, f2w2, f3w3, ...)
where F is the combination function, which can be addition, multiplication, maximum, minimum, and so forth, and wn is weight used to set the importance of each similarity feature.
The use of weights makes the merging process adaptive. That is, the merging of objects can be controlled by the setting of weights by the user at runtime or can be selected automatically by the vision system based on other operational parameters, such as the type of data being processed, environmental conditions, noise levels, and so forth. This method is a good example of how a vision system can be made `intelligent.`
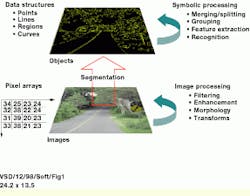
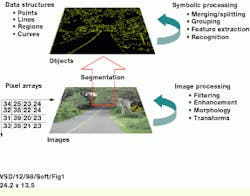
Note that at this level of algorithm design, the techniques under discussion are greatly facilitated by the availability of tools for symbolic representation and processing. That is, the vision engineer should have access to a set of programming tools that provide representations and to a database-management system for images and their pixel-based representation, as well as for the geometric shapes and attributes of these objects, which are sometimes referred to as features (see Fig. 1).
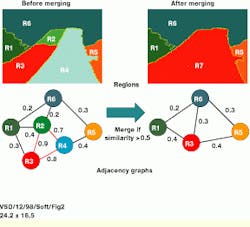
Object adjacencies can be stored in such a symbolic database as links, and similarity scores can be stored as attributes of the links. Conceptually, the links and the attributes can be envisioned as graphic-like structures, where each node in the graphic is an object in the image, and the links in the graphic denote the adjacency of objects in the image (see Fig. 2).
Merging techniques
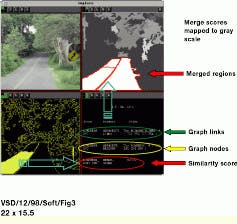
Figure 3 illustrates the use of merging techniques on an outdoor road scene. The initial regions were derived using a threshold-by-maximal-contrast technique (see Vision Systems Design, Oct. 1998, p. 20). This operator breaks the scene into small segments based on the selection of thresholds that will maximize detected edge contrast. Additional operators were applied to measure features of the objects such as color, size, shape, and texture. These properties were then stored in the symbolic database as attributes of the objects. Next, a process was run to calculate the object adjacency relationships. Lastly, a new attribute for the object-set was created, which consisted of a pointer (software link) to adjacent objects.
This algorithm was created using a special morphology library that operates on objects, as opposed to pixels. Each object is dilated, creating a neighborhood about the object. Because an object representation is used, as opposed to a pixel representation, objects retain their distinct identity, even when they `overrun` their adjacent objects. A logical And-ing (set intersection) is used to test objects for overlaps. When these overlaps are detected, links between the overlapping (adjacent) objects are created in the database. This sets the stage for subsequent merging operations.
The merging process is implemented as follows:
For each object in the database with one or more adjacent links, calculate the similarity score for each link.
If the highest similarity score on all links is above some preselected minimal value, then merge the adjacent regions with the highest score.
Compute the new feature statistics for the merged region.
Iterative merges can then be performed until no adjacent pairs have a similarity score below a preselected minimal value. The result is a final image segmentation.
Because regions with large internal variations tend to merge with anything, the measured standard deviations of features used in the similarity subfunctions can be clipped to a user-supplied limit. That is, for each similarity metric (fn), the resulting value can be the minimum of the actual value or a user-supplied limit for each feature: fn = min (fn, Limitn).
PETER EGGLESTON is senior director of business development, Imaging Products Division, Amerinex Applied Imaging Inc., Northampton, MA; e-mail: [email protected].
FIGURE 1.Software-development tools that provide for symbolic data representation and processing, in addition to pixel-based representation and processing, allow vision engineers to more rapidly prototype and field systems that incorporate more sophisticated forms of processing, such as region merging.
FIGURE 2.Graphic data structures and processing methods can be used to facilitate region merging. As shown, regions in the image correspond to nodes in a graph, where adjacencies are represented as links between the nodes. Similarity scores can be calculated and attached to the links. This approach allows graphic-reduction techniques to be used to reduce the graphic and, therefore, merge the regions in the image.
FIGURE 3.Each segment in this road scene is stored as a record in a database, and the corresponding features such as color and size are stored as fields in these records. Processes that detect adjacent objects store this information as links in the database. That is, new fields are created and used to store pointers to other records that correspond to adjacent objects. Lastly, region merge scores can be calculated for each record`s links, and are used in the merging decision-making process. A view of one such record for the yellow-highlighted object is shown in the image`s lower right quadrant. Links to neighboring objects, as well as the neighboring objects themselves, are displayed as reference addresses.


