Deep learning algorithms use density-based crowd counting to track penguin populations
Data science consulting company Gramener (Princeton, NJ, USA; www.gramener.com) partnered with the AI for Earth initiative (bit.ly/VSD-AIFE) run by Microsoft (Redmond, WA, USA; www.microsoft.com) to create a deep learning-based vision system for analyzing images from camera traps in Antarctica.. The solution requires convolutional neural networks (CNN) trained to make population-count estimations based on density-based crowd counting techniques. (Figure 1).
Gramener, founded in 2010, produces data stories, or visualizations with hundreds, thousands, or millions of regularly updatable data points to refresh the visualization with new data, according to Ganes Kesari, co-founder and head of analytics. While Gramener has produced data stories for business intelligence departments, cyber security firms, and political scientists, the company also showcases its ability to use artificial intelligence (AI) for social good (gramener.com/aiforgood).
That work is sometimes sponsored by Microsoft’s AI for Earth initiative, a series of grants and technical resources supporting the use of AI for solving environmental challenges. Animal conservation efforts in particular benefit widely from the application of AI and computer vision to the challenge of automated animal population counting. Population counts rising or falling over time fairly measure the success or failure of conservation efforts.
Gramener, through this partnership, developed a web-based AI solution for monitoring salmon populations in the Nisqually River in the state of Washington in the United States (bit.ly/VSD-NISQLY). Camera traps, cameras activated by motion, set at narrow parts of the river capture images of fish swimming past the camera. In the past, human researchers would review the images to determine the amount of salmon captured by the cameras. Now, the AI solution can sift through the river camera trap footage to identify and differentiate between 12 different species of salmon.
When images encompass hundreds of animals rather than one or only a few, the complexity of the needed AI model increases markedly. Crowd photos present occlusion-based challenges. Scale variation, the size of an individual in an image relative to its distance from the camera, grows more pronounced with larger depth of field.
The beginnings of a solution to the problem were presented in 2016 in a benchmark paper titled Counting in The Wild (bit.ly/VSD-CITW), written by researchers from the Department of Engineering Science at the University of Oxford (Oxford, Oxfordshire, UK; www.ox.ac.uk ) and the Skolkovo Institute of Science and Technology (Moscow, Russia: www.skoltech.ru/en). The researchers’ experiments use datasets of images annotated via the Penguin Watch (bit.ly/VSD-PNGW) project on the Zooniverse (www.zooniverse.org) citizen scientist website.
The Penguin Watch project, created by Tom Hart, a doctoral research fellow at the University of Oxford, asks volunteers to annotate pictures of penguin populations taken from camera trap sites on Antarctica by placing a dot over each penguin. When Counting in The Wild was written, images had been drawn from over 40 sites for a period of three years, producing over 500,000 images with resolutions between 1 and 6 MPixels.
The size of the dot placed by an annotator on each penguin in an image does not change, even though based on its distance from the camera the diameter of a penguin in the image could range between ~15 and ~700 pixels. The more difficult the image annotation, the more likely the volunteers under-count, creating false negatives more frequently than false positives. Cluttered images—those with more than 30 penguins—were particularly prone to missing annotations.
Other sources of error include varying camera placements, for instance wide shots where large numbers of penguins appeared at low resolutions, or placements that created large amounts of occlusion. Weather conditions could also obscure images, presenting yet another challenge for annotators.
All these issues taken together result in the creation of noisy data for a density estimation computer vision system to process. The researchers devised three learning processes that assist a convolutional neural network in interpreting this noisy data.
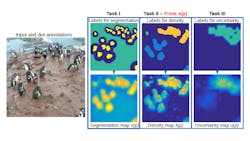
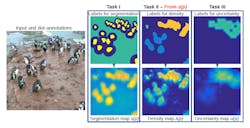
The first process incorporates an explicit foreground-background segmentation to help exclude areas of the image not relevant to the prediction of individual penguin locations. The second process interprets spatial variations between annotations, the space between the annotation dots on the images, as cues regarding the scale of the annotated objects. The third process uses counting variability—the difference in counts on the same images from different annotators— to teach models how to estimate local uncertainty, which informs whether or not a computer vision system predicts the presence of an individual penguin (Figure 2).
Experiments used ~82k images of lower-crowded and medium/lower-crowded groups of penguins. The CNN used in the experiments is based on the VGG-16 architecture. Two metrics measure test accuracy: the degree to which the CNN produces similar results to the annotators, and the CNN’s uncertainty about the presence of a penguin as compared to the uncertainty of the annotators. If the CNN has similar uncertainty to the annotators, that indicates the system effectively replicates the work of the human annotators.
The counts reported by the CNN demonstrated good counting accuracy compared to the human annotators. The researchers concluded, however, that more work was needed where uncertainty estimations and use of crowdsourced, dot-annotated images were concerned.
Another paper, titled CNN-based Cascaded Multi-task Learning of High-level Prior and Density Estimation for Crowd Counting (bit.ly/VSD-CNNDC), written by researchers from the Department of Electrical and Computer Engineering at Rutgers University (New Brunswick, NJ, USA; www.rutgers.edu) and published in 2017, more directly informed Gramener’s penguin counting project.
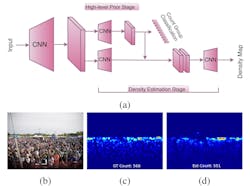
Where Counting in the Wild dealt with automated crowd counting using low density crowd scenes, the researchers from Rutgers University were concerned with high density crowd images. Once again, non-uniform scale variation represents the primary challenge addressed by the paper. A cascading network of CNNs that simultaneously classifies crowd counts and estimates density maps, provides the solution (Figure 3).
In this approach, the model learns to classify areas of an image by density, creating heat maps where a greater density of individuals presents as hot while an absence of individuals appears cool. Because the training process utilizes annotated images, the model knows ground truth—the actual number of individuals in the image—and therefore can estimate how many individuals are represented within a “hot” portion of the heatmap for that particular image.
For example, if an image has 100,000 people in total, the hot portions of that heatmap will encompass more individuals that the hot portions of a heatmap with only 20,000 people. Once trained, the model counts the number of individuals in any image and draws a density map simultaneously, combining the calculations into a population estimate.
The CNNs for the Rutgers University study were trained over six hours on a GTX TITAN-X GPU from NVIDIA (Santa Clara, CA, USA; www.nvidia.com) that used the Torch AI (Leawood, KS, USA; www.torch.ai) framework and Adam optimization (bit.ly/VSD-ADAM), and were tested on two datasets. The ShanghaiTech dataset (bit.ly/VSD-SHDS) contains 1198 annotated images broken down into training and test datasets. The UCF_CC_50 dataset (http://bit.ly/VSD-UCF50), noted by the researchers as extremely challenging, contains 50 annotated images of varying resolutions and aspect ratios, with a large variation in crowd densities.
Tested on the ShanghaiTech dataset against three other automated crowd counting methods and tested on the UCF_CC_50 dataset against five other methods, the CNNs developed by the Rutgers University researchers demonstrated lower error rates than any other system used in the tests.
The Rutgers University research made possible the work performed by Gramener for the penguin counting project, using data taken from the Penguin Watch project.
“The principles and the model architecture remain the same,” says Soumya Ranjan, Lead Data Scientist at Gramener. “Only the data changes.”
The team at Gramener used the PyTorch framework for their CNN architecture, and trained the model on the Microsoft Azure cloud platform using virtual NC6 v3 machines with NVIDIA Tesla V100 data center GPUs. Training took three to four days for 200 epochs.
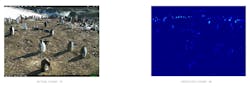
While Gramener’s penguin counting model (bit.ly/VSD-PNGCM) only provides estimates, it could still give conservationists monitoring Antarctic penguin populations a way to detect rapid population changes, for good or ill, and quickly gain insights from the Penguin Watch cameras (Figure 4).
Gramener has worked with Microsoft AI for Earth to create a species classification API that identifies more than 5,000 plant and animal species, and a camera trap API that detects and identifies animals in camera trap images. These APIs are publicly available (bit.ly/VSD-AIFEAPI) on the Microsoft AI for Earth website.
Related stories:
Deep learning powers chimpanzee face recognition research
4D tracking system recognizes the actions of dozens of people simultaneously in real time
Deep learning enables everyday digital cameras to see around corners
Share your vision-related news by contacting Dennis Scimeca, Associate Editor, Vision Systems Design
About the Author

Dennis Scimeca
Dennis Scimeca is a veteran technology journalist with expertise in interactive entertainment and virtual reality. At Vision Systems Design, Dennis covered machine vision and image processing with an eye toward leading-edge technologies and practical applications for making a better world. Currently, he is the senior editor for technology at IndustryWeek, a partner publication to Vision Systems Design.